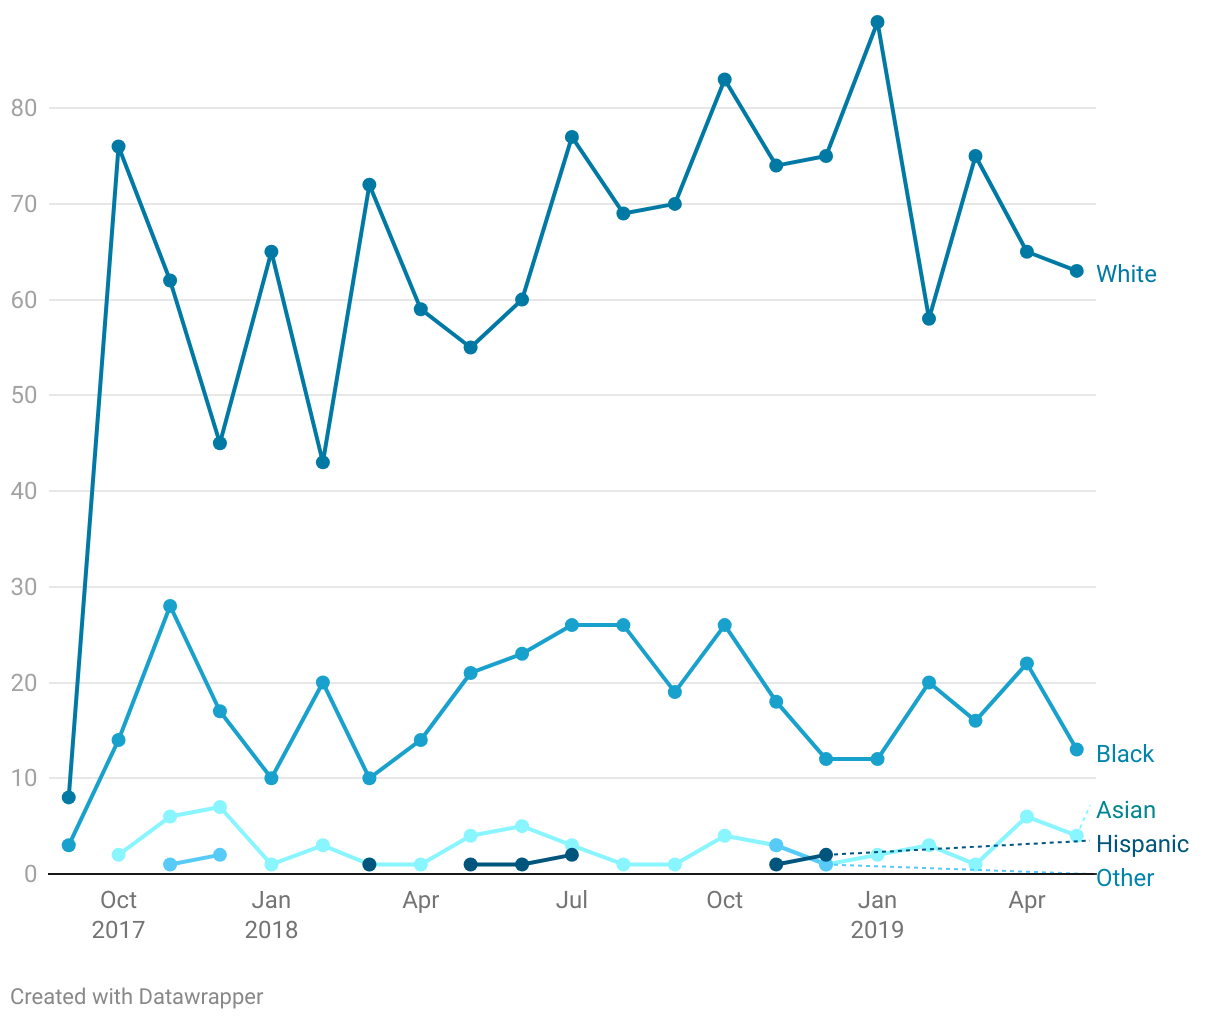
Line graph showing a count of incident numbers over a given month. Each month shows a clear higher rate of incidents for black folks than any other race, and a disproportionate representation for black folks compared to population.
Burlington Arraignment Dates Over Time (2017-2019)
Count of incident numbers over time.