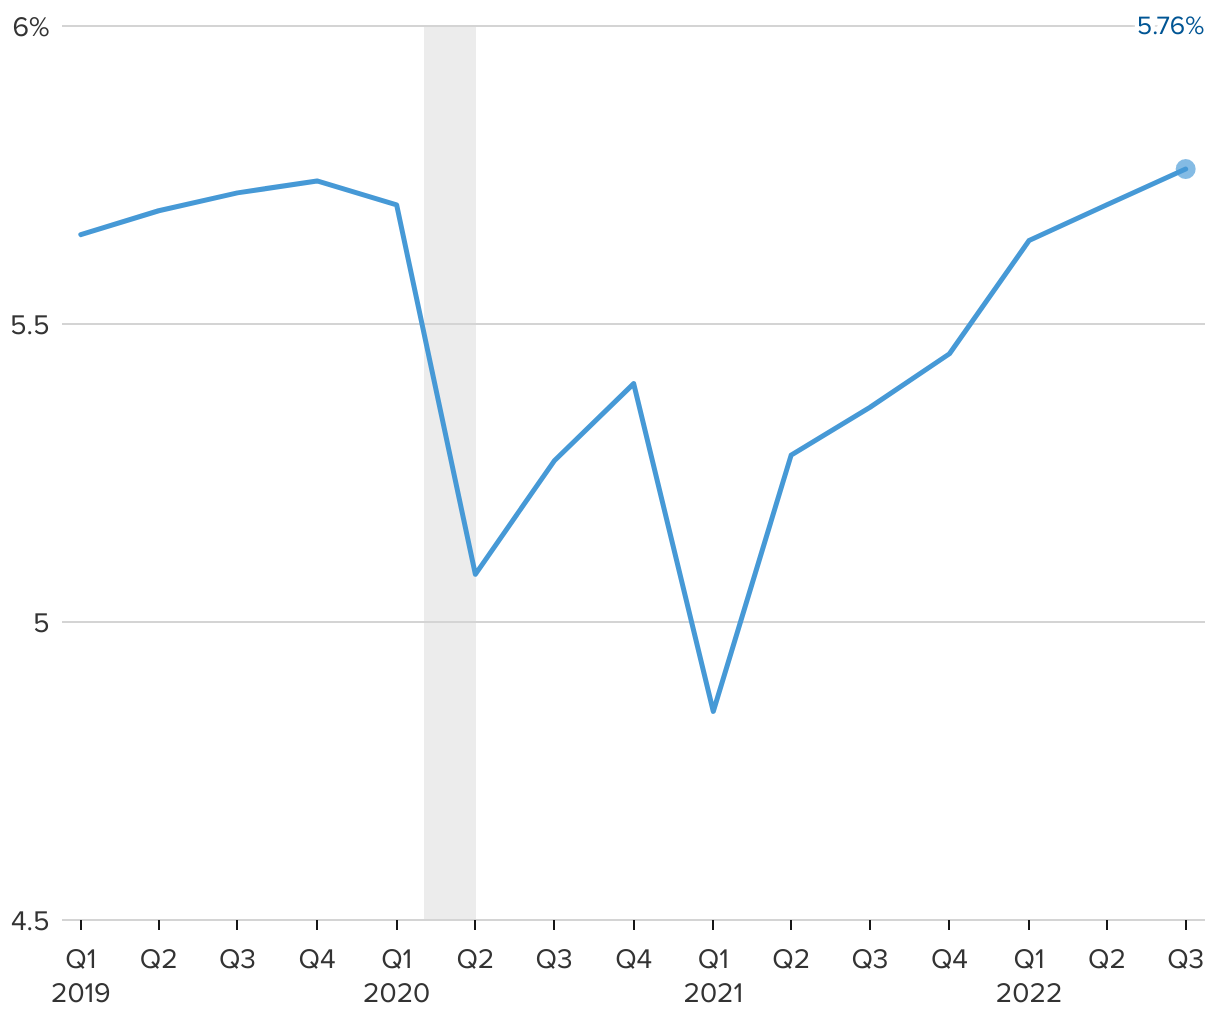
The share of household income going toward consumer debt is at pre-pandemic levels
Household debt service payments as a percent of disposable personal income
The line chart shows the share of personal disposable income that households are using to pay consumer debt, from Q1 2019 through Q3 2022.