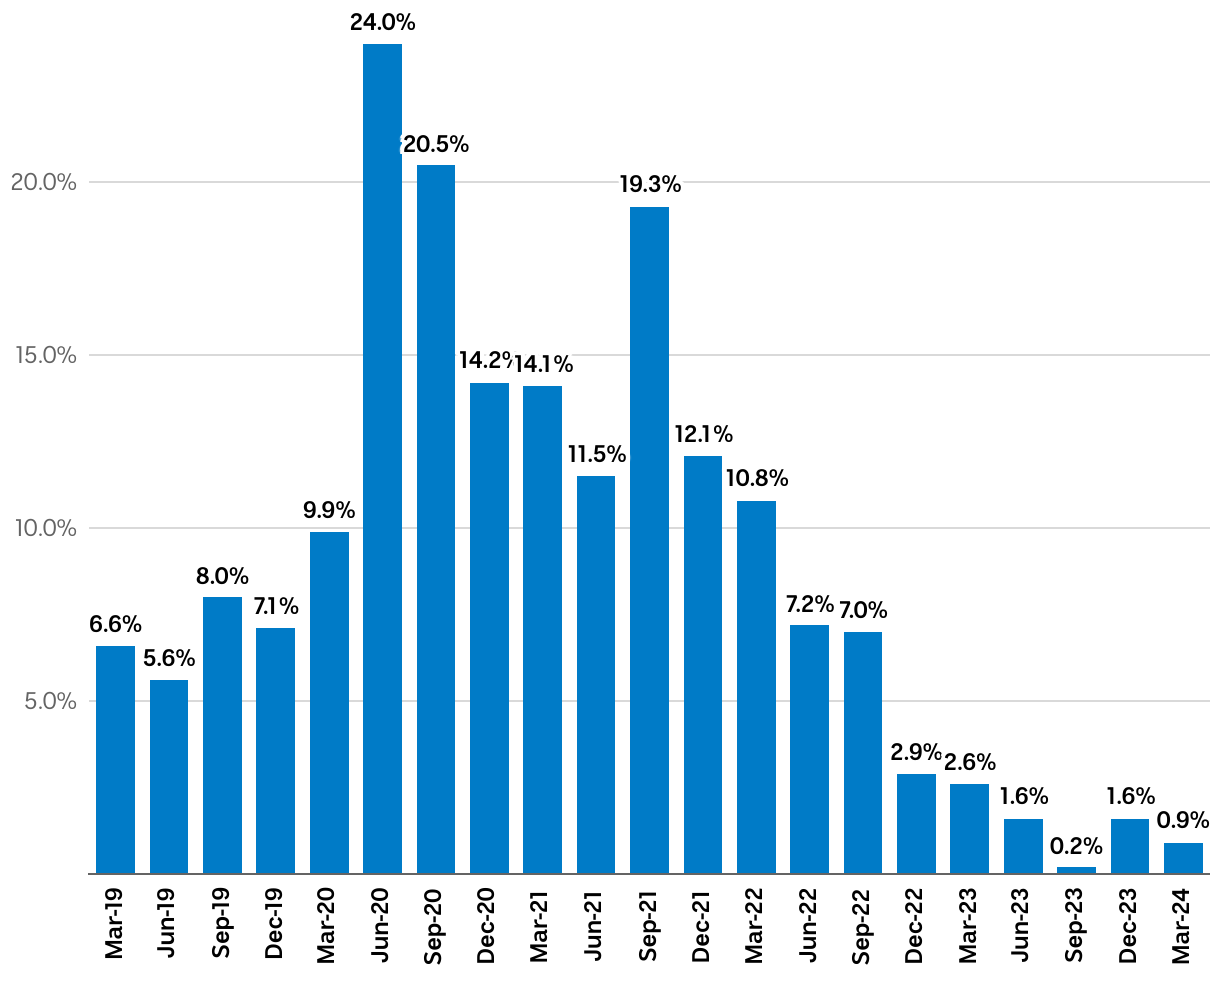
Household savings ratio
A graph with blue lines that shows the last 5 years worth of household savings ratio data
(Please use a modern browser to see the interactive version of this visualization)