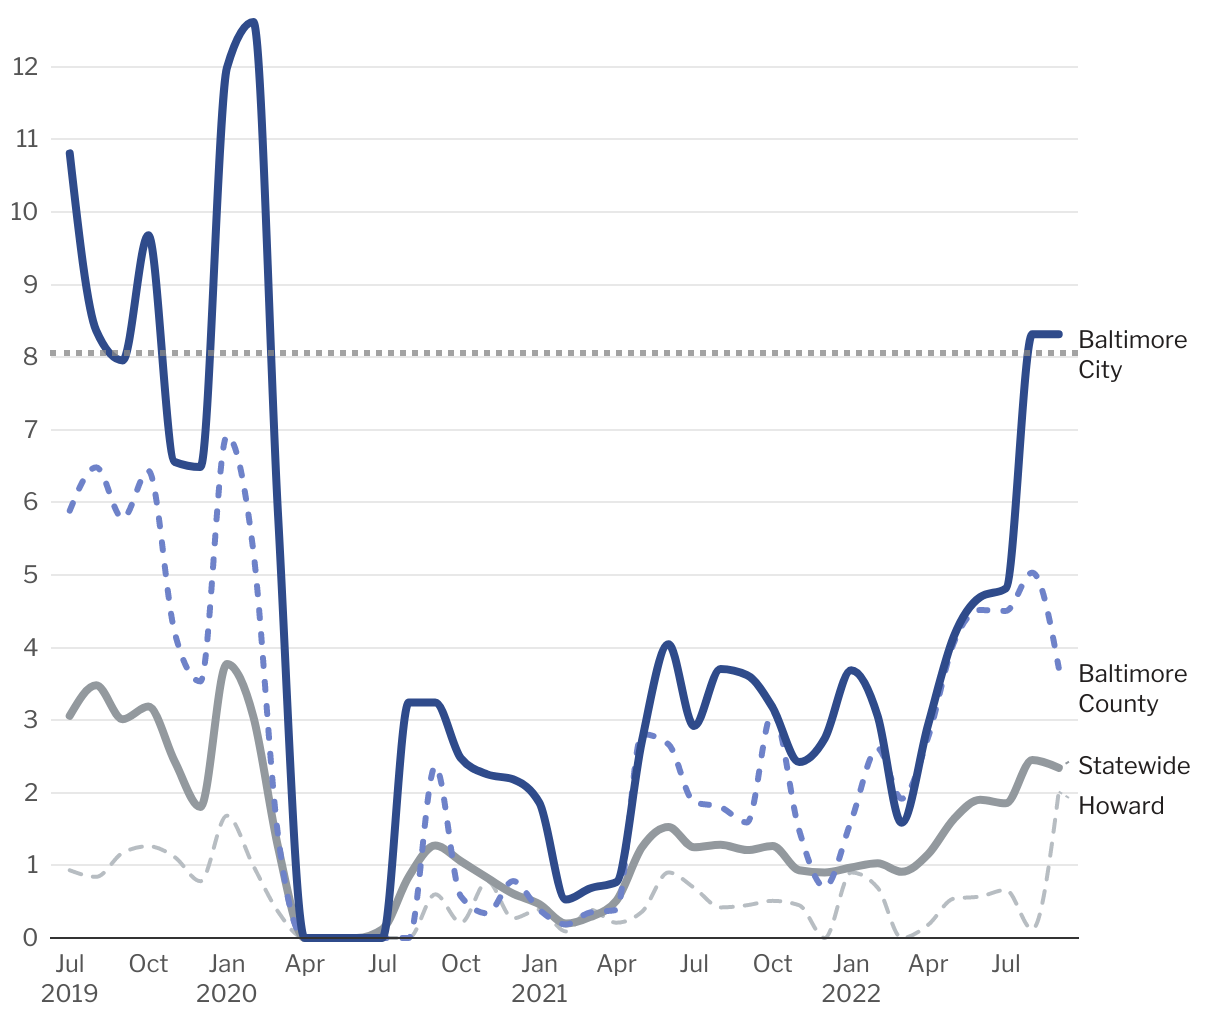
Once closely mirroring per-person rates in Baltimore County, Baltimore City evictions have increased rapidly
More than twice the rate of people were forcibly removed in the city compared to the county in August and September 2022. About 8 people were evicted each month for every 10,000 city residents, compared to 4 in Baltimore and 3 statewide.
This is a bar chart that visualizes the change in per capita forcible removals by month since July 2019.