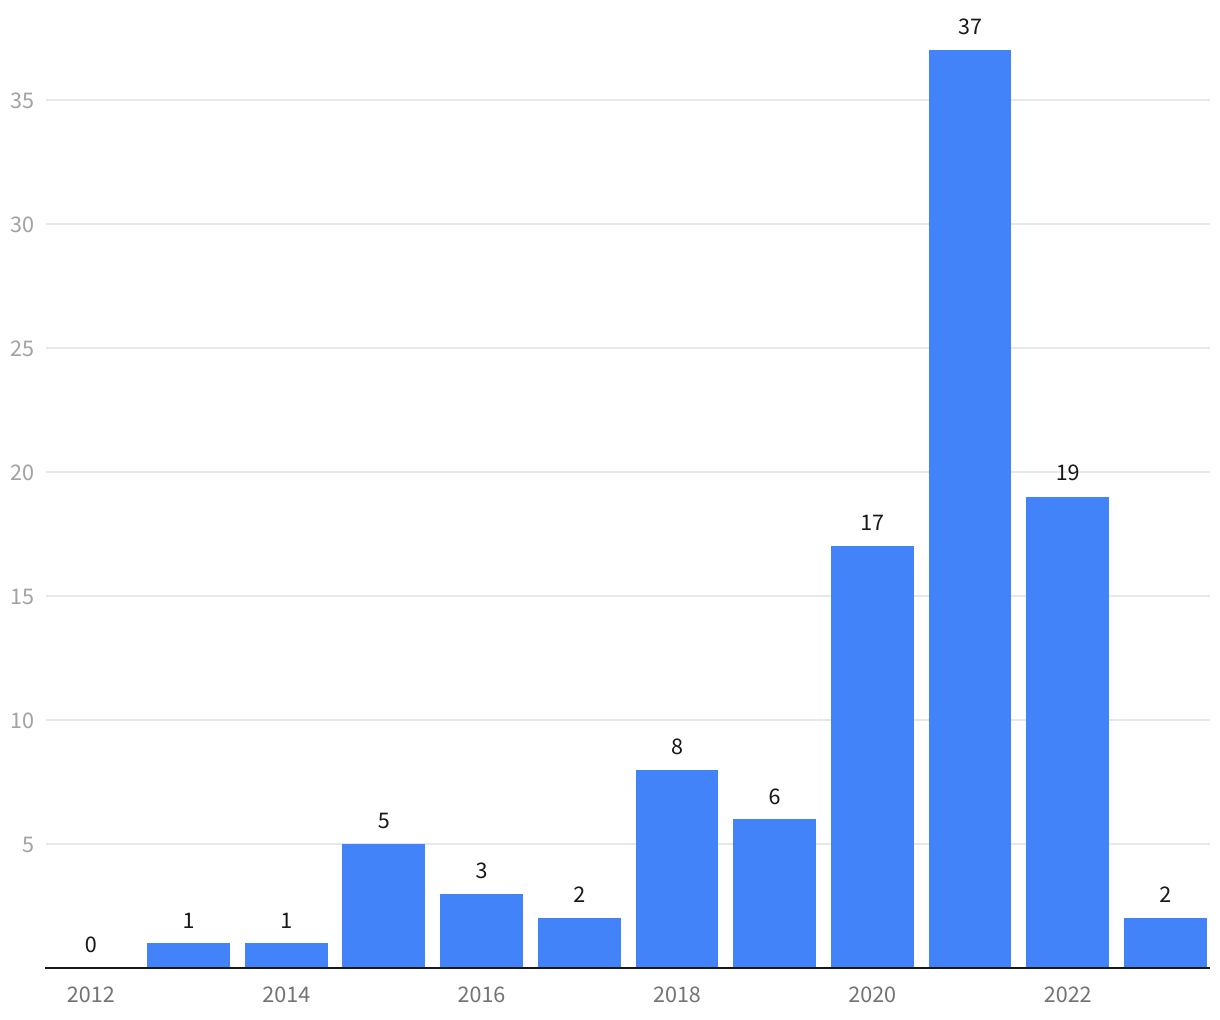
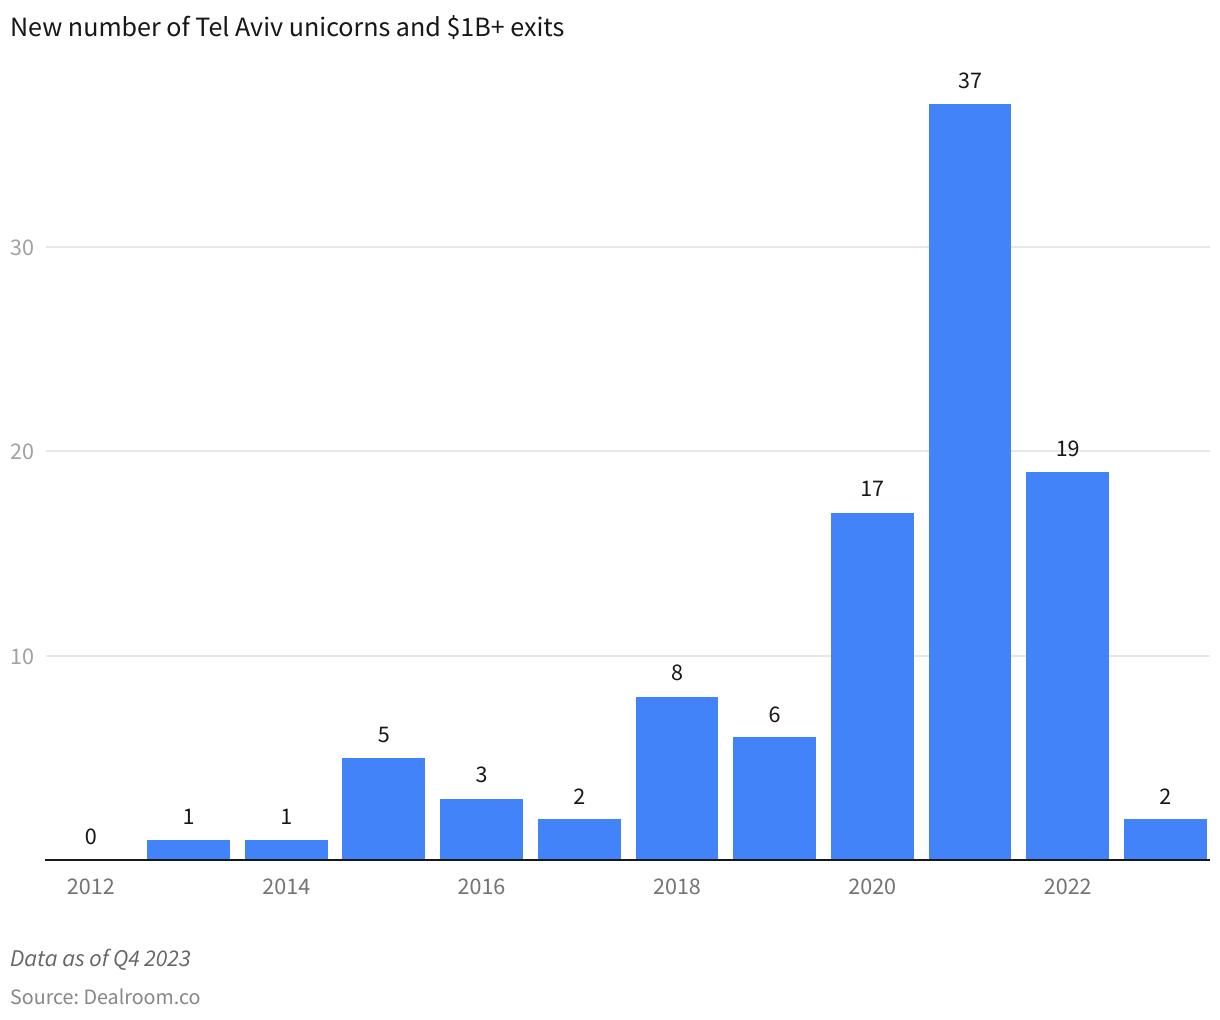
New number of Tel Aviv unicorns and $1B+ exits
A line graph depicting new data from Dealroom on Australian unicorns and $1B+ exits. The x-axis represents time and the y-axis represents the cumulative number of occurrences. The graph is composed of a single line, representing the cumulative number of impact unicorns over time.