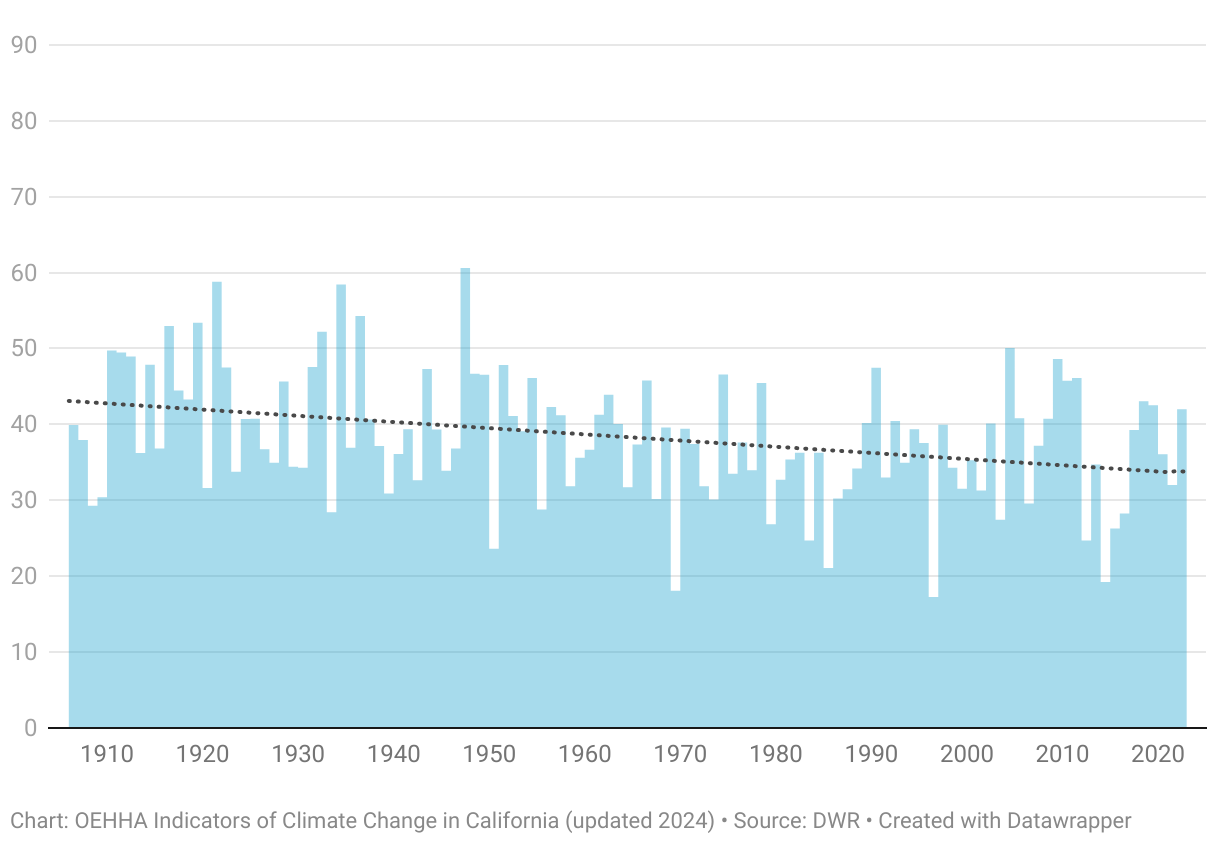
This graph shows a decline in the Sacramento River's annual runoff between April and July as a percent of the total runoff for that water year.
(Please use a modern browser to see the interactive version of this visualization)
