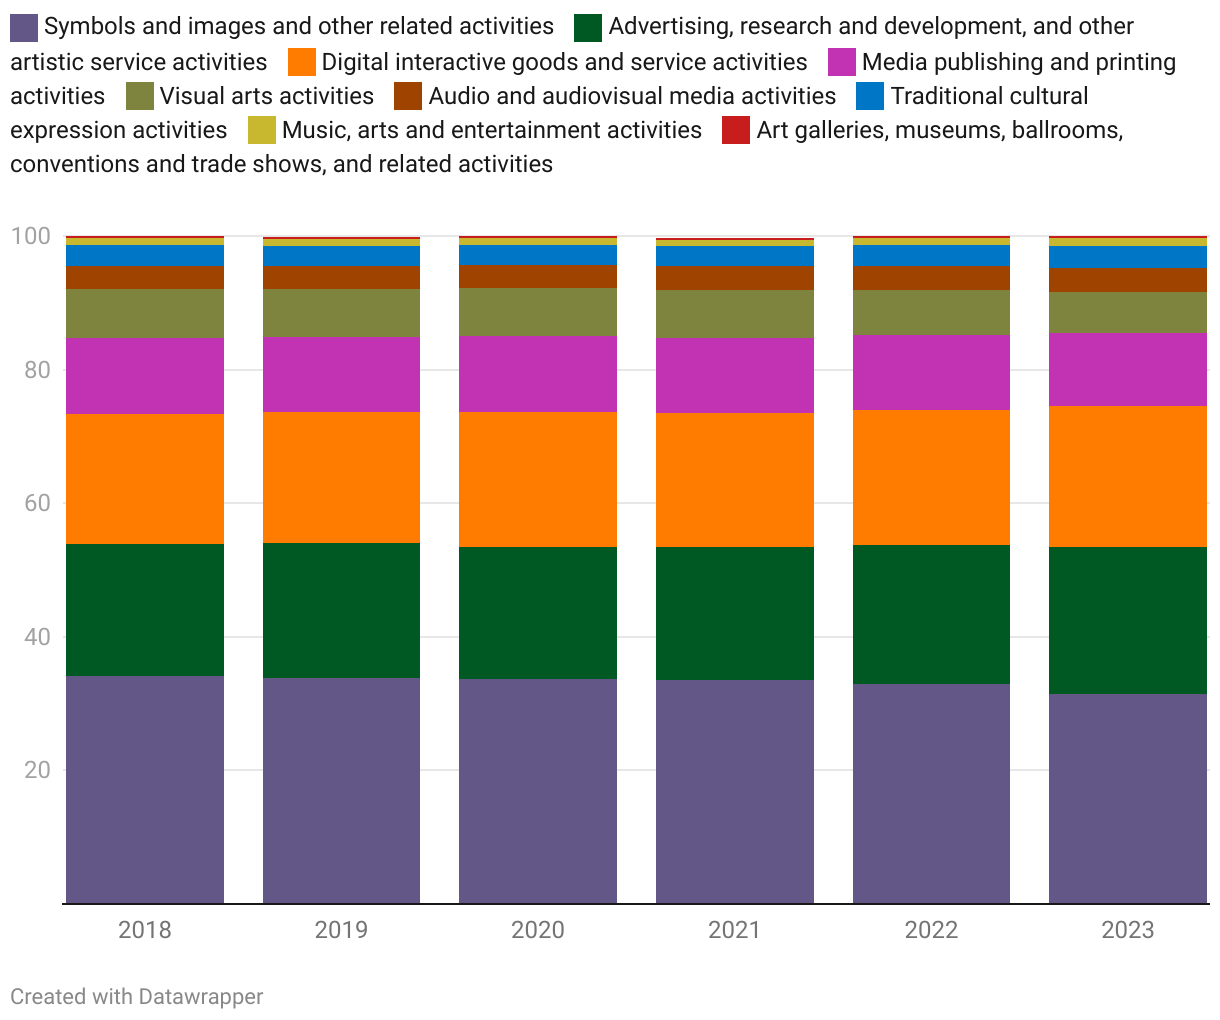
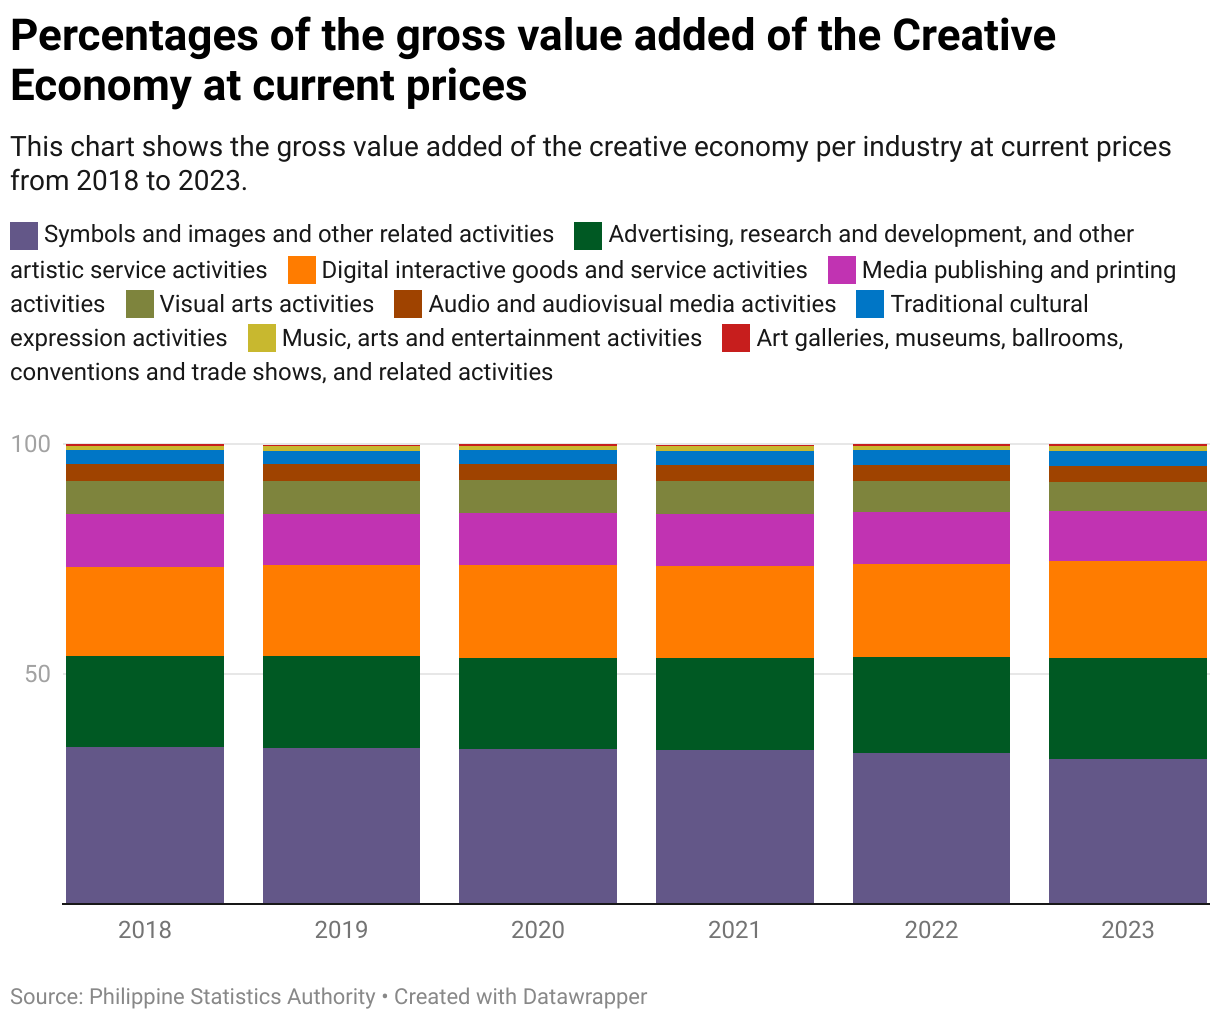
Percentages of the gross value added of the Creative Economy at current prices
This chart shows the gross value added of the creative economy per industry at current prices from 2018 to 2023.
This chart shows the gross value added of the creative economy per industry at current prices from 2018 to 2023.