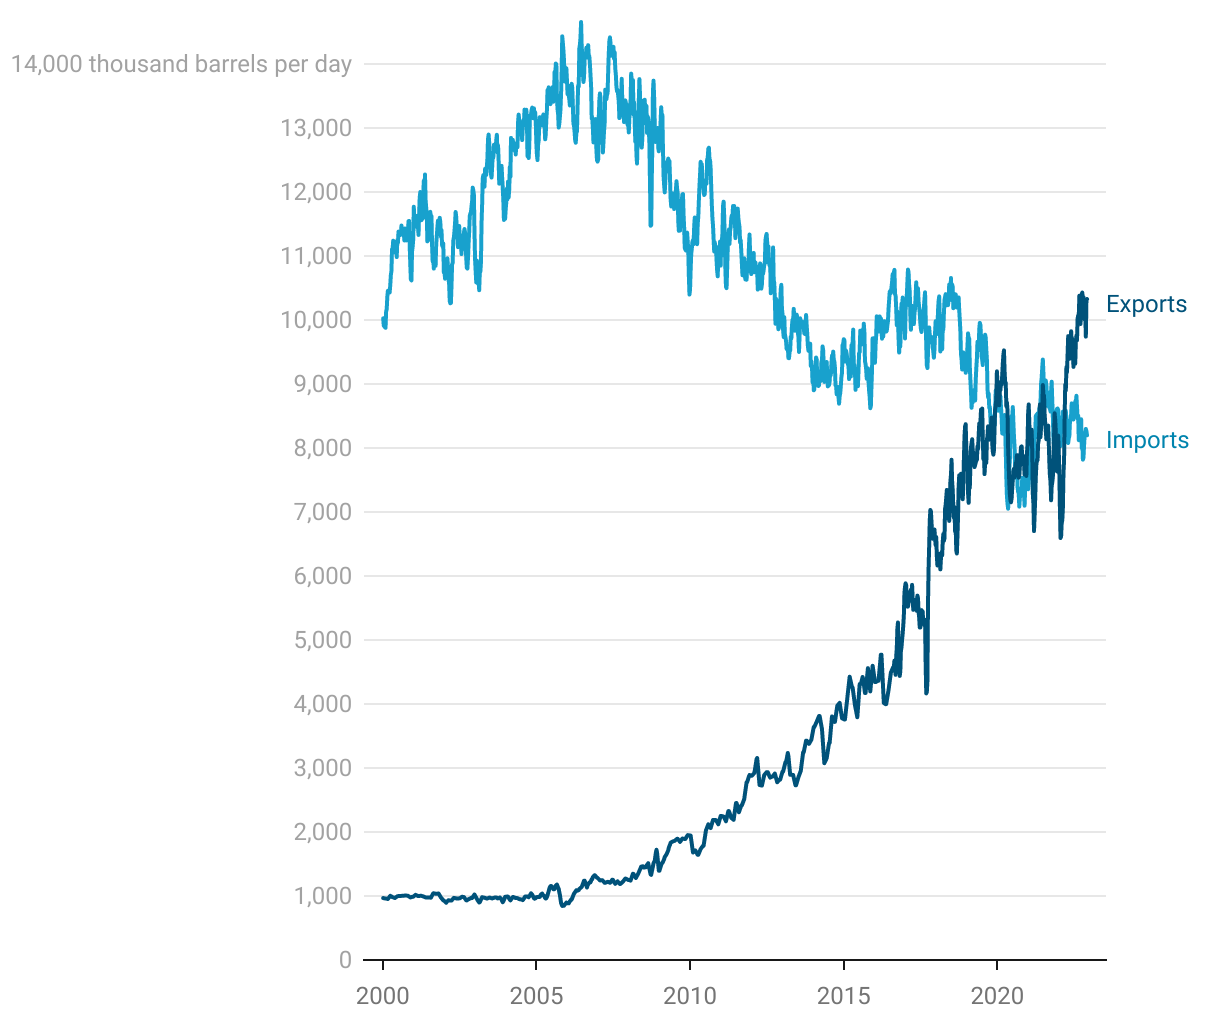
U.S. Oil Exports Surpassed Imports in 2020
2022 brought record highs in oil exports
This is a time series line graph from 2000 to the present day. There are two lines on the graph: US oil exports, and US oil imports.
The line for oil imports is much higher than exports throughout most of the graph, especially around 2006 when oil imports peaked. But after that imports began to shrink and exports grew rapidly.
Beginning in February 2022, US oil exports have been consistently larger than US oil imports.