Upper- and single-tier local authority usable reserves as a proportion of service expenditure, by local authority, 2009/10–2024/25

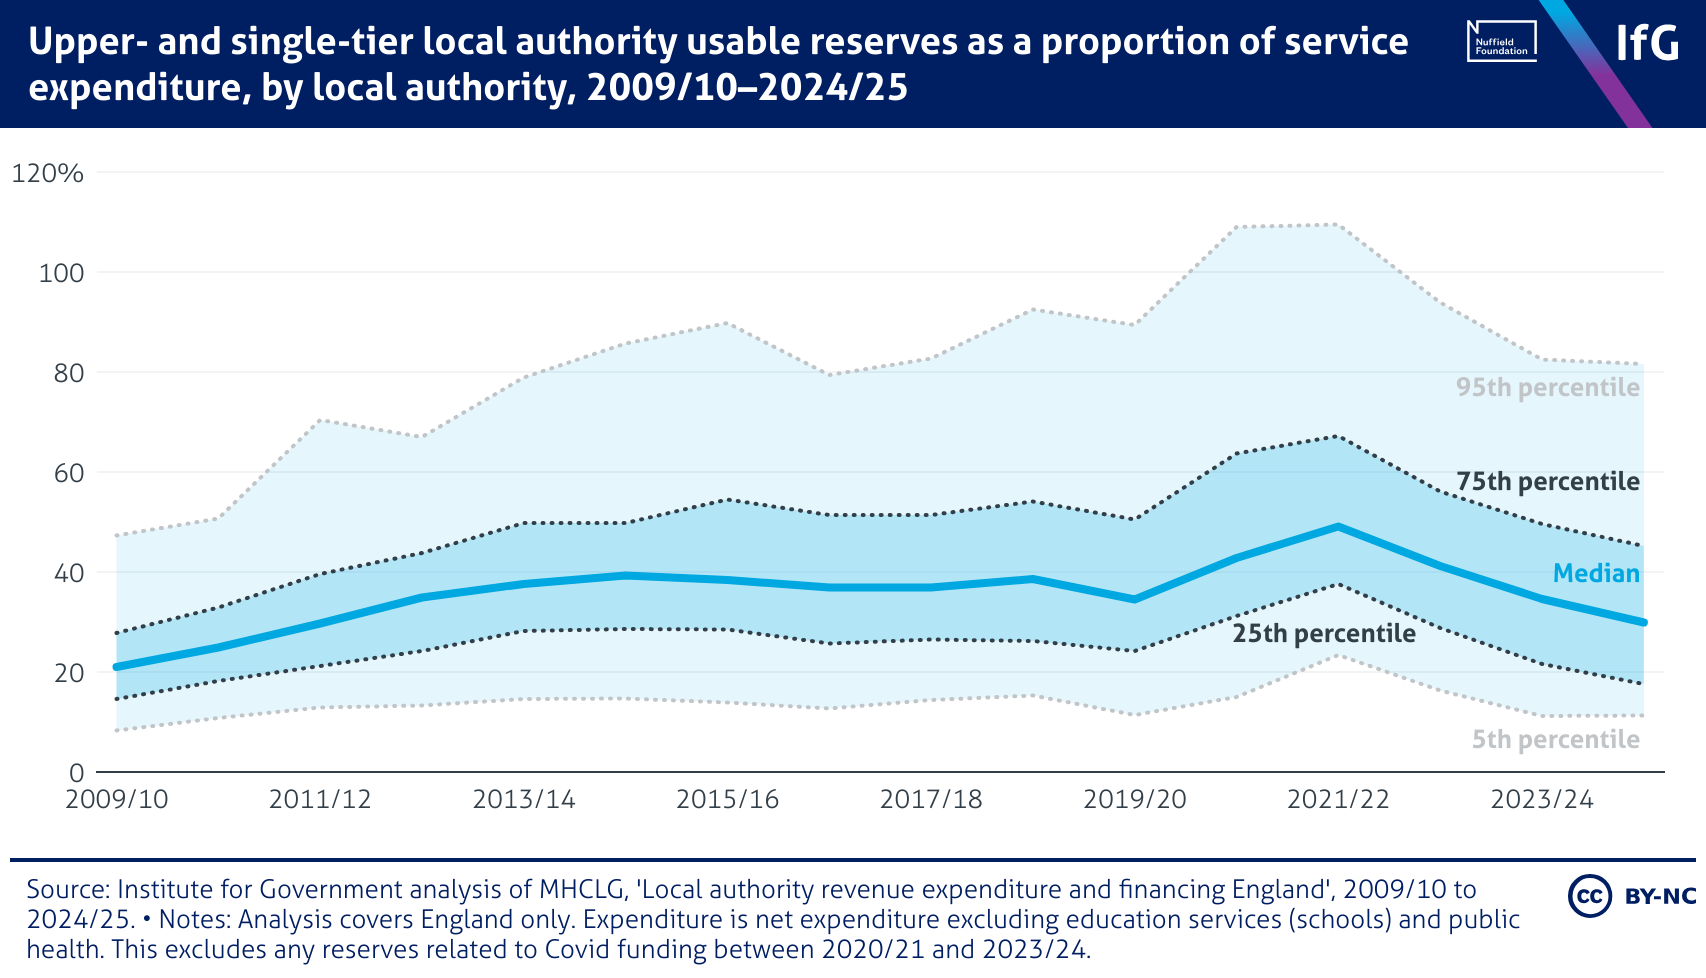
A line chart from the Institute for Government of upper and single-tier local authority usable reserves as a proportion of service expenditure, by local authority, 2009/10–2024/25, where the median and percentiles tended to rise gradually before peaking in 2021/22 and then declining. The gap between the 5th and 95th percentile is much higher in 2024/25 than it was in 2009/10.

