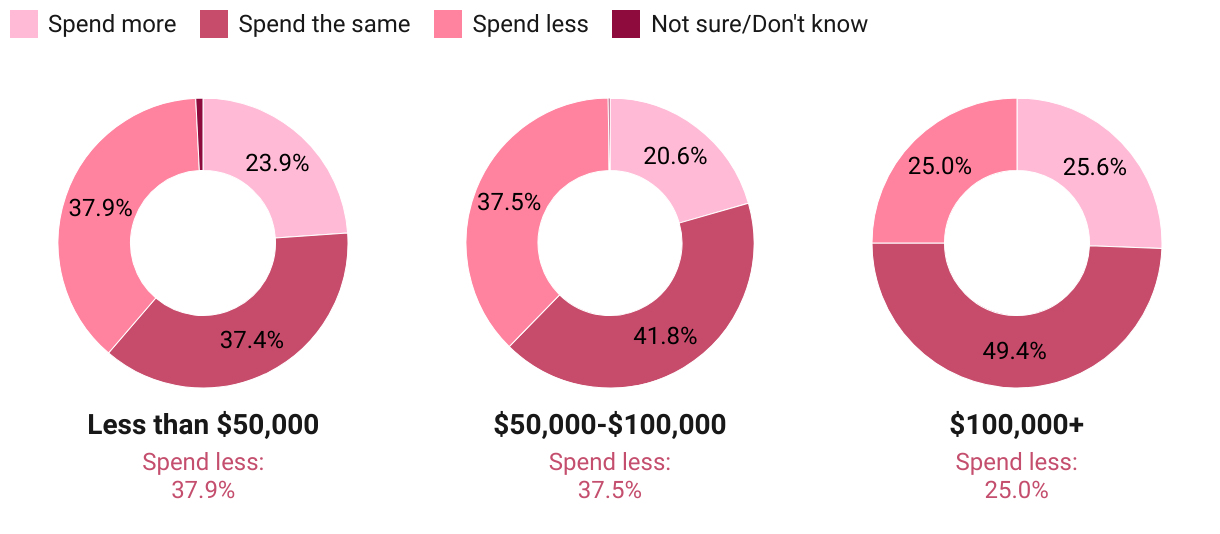
Reduced spending largely among households earning less than $100,000 per year
Seventy-five percent of upper-income households will at least spend the same amount as last year on gifts for others this holiday season
Donut charts by income showing spending this season relative to a year ago.