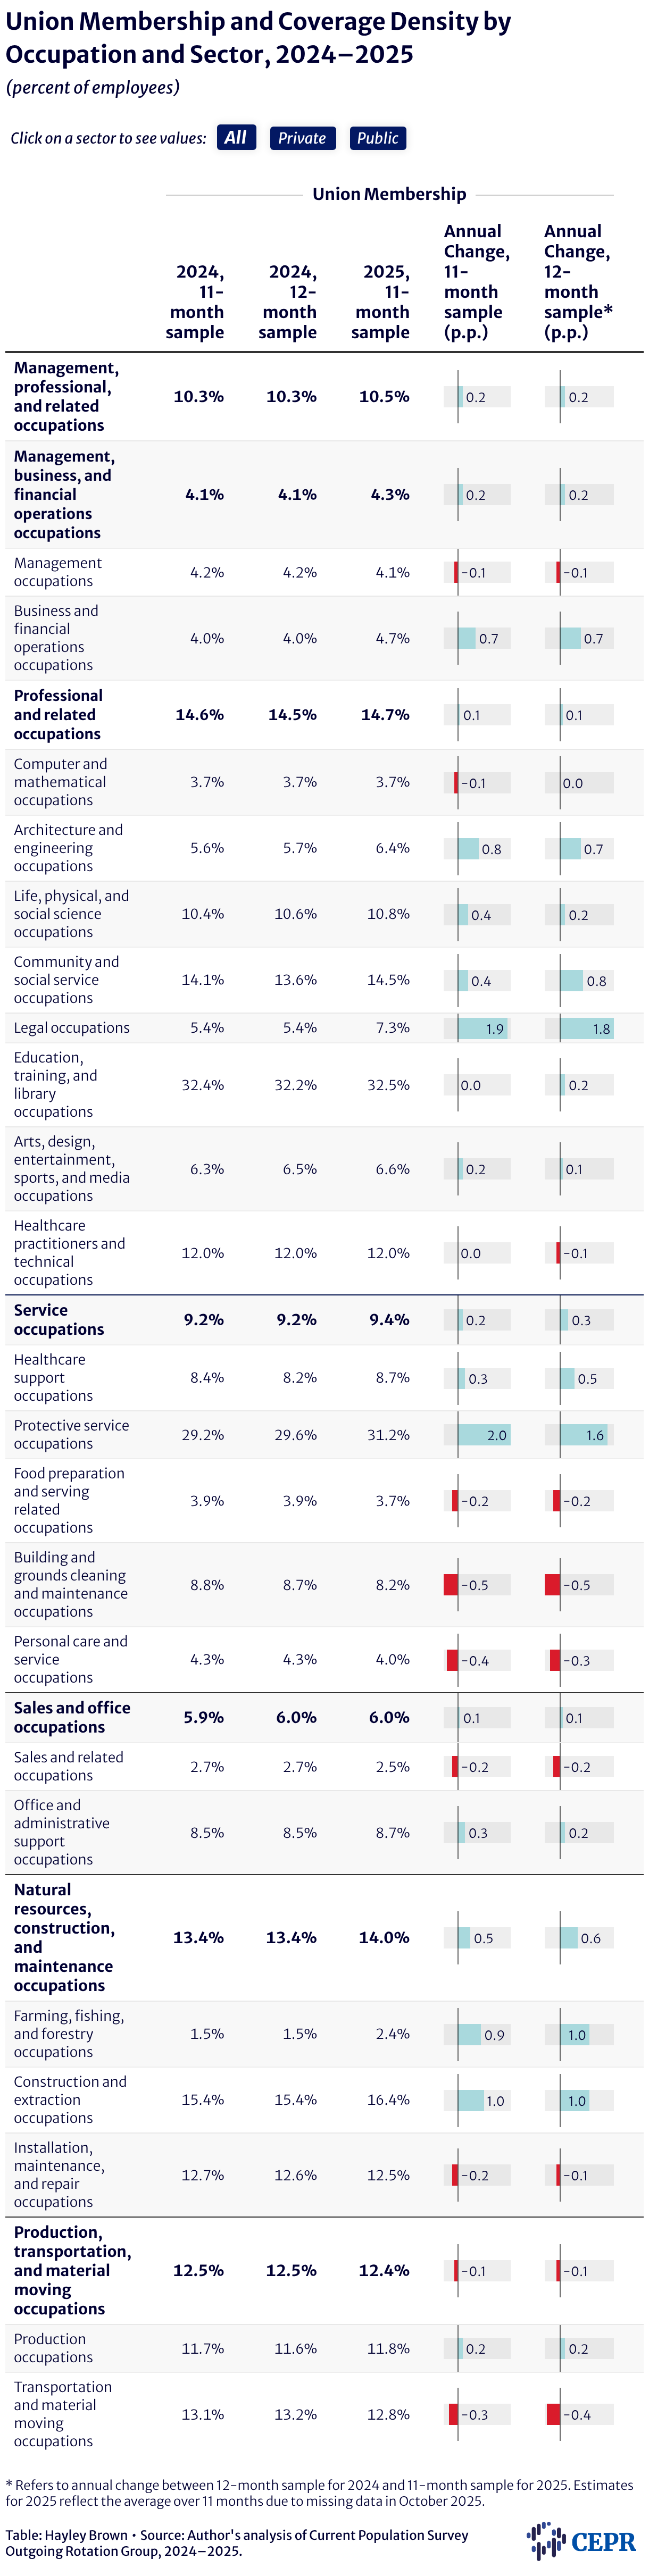
Union Membership and Coverage Density by Occupation and Sector, 2024–2025
(percent of employees)
Click on a sector to see values:
All
Private
Public
Table showing union membership and coverage density by sector and occupation for 2024 and 2025. Includes values for both the 11-month and 12-month samples for 2024. Year-over-year changes using both samples are shown as bar charts within the table, with positive changes in light teal and negative changes in red.

* Refers to annual change between 12-month sample for 2024 and 11-month sample for 2025. Estimates for 2025 reflect the average over 11 months due to missing data in October 2025.