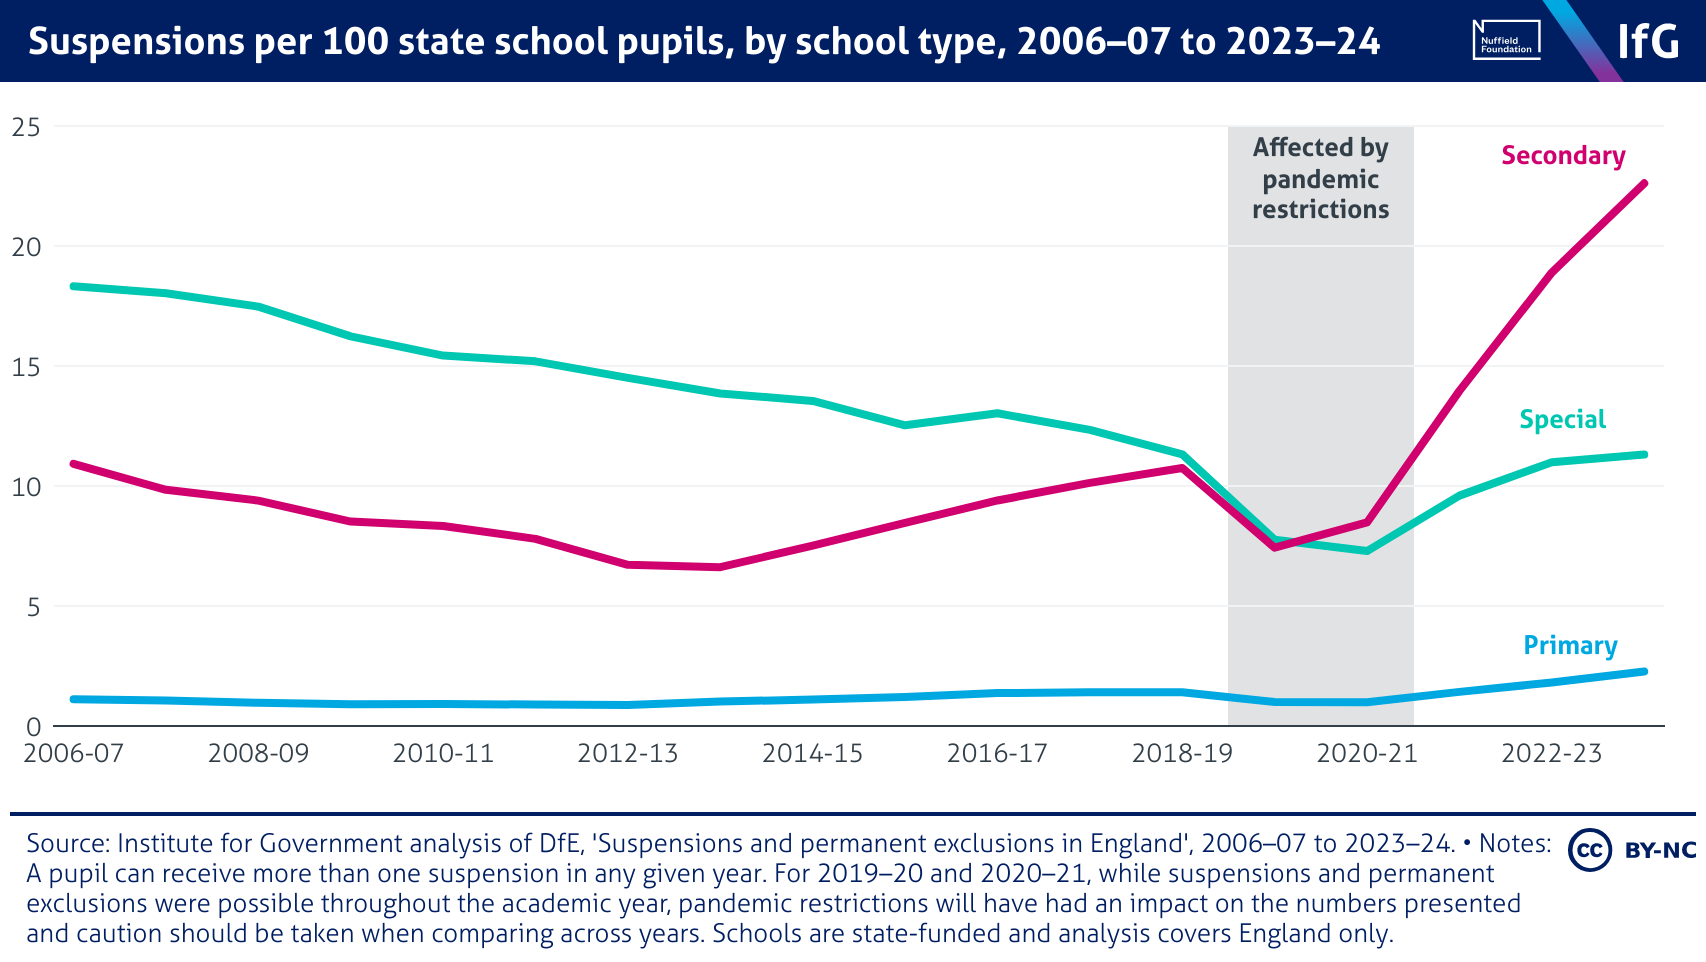
Suspensions per 100 state school pupils, by school type, 2006–07 to 2023–24

A line chart from the Institute for Government of suspensions per 100 state school pupils, by school type, 2006–07 to 2023–24, where suspensions have increased in every year since the pandemic, in every school type. This has been most marked in secondary schools, with an average of 22.6 suspensions per 100 pupils in 2023–24, more than double the highest rate seen pre-pandemic and equivalent to five in every class.

