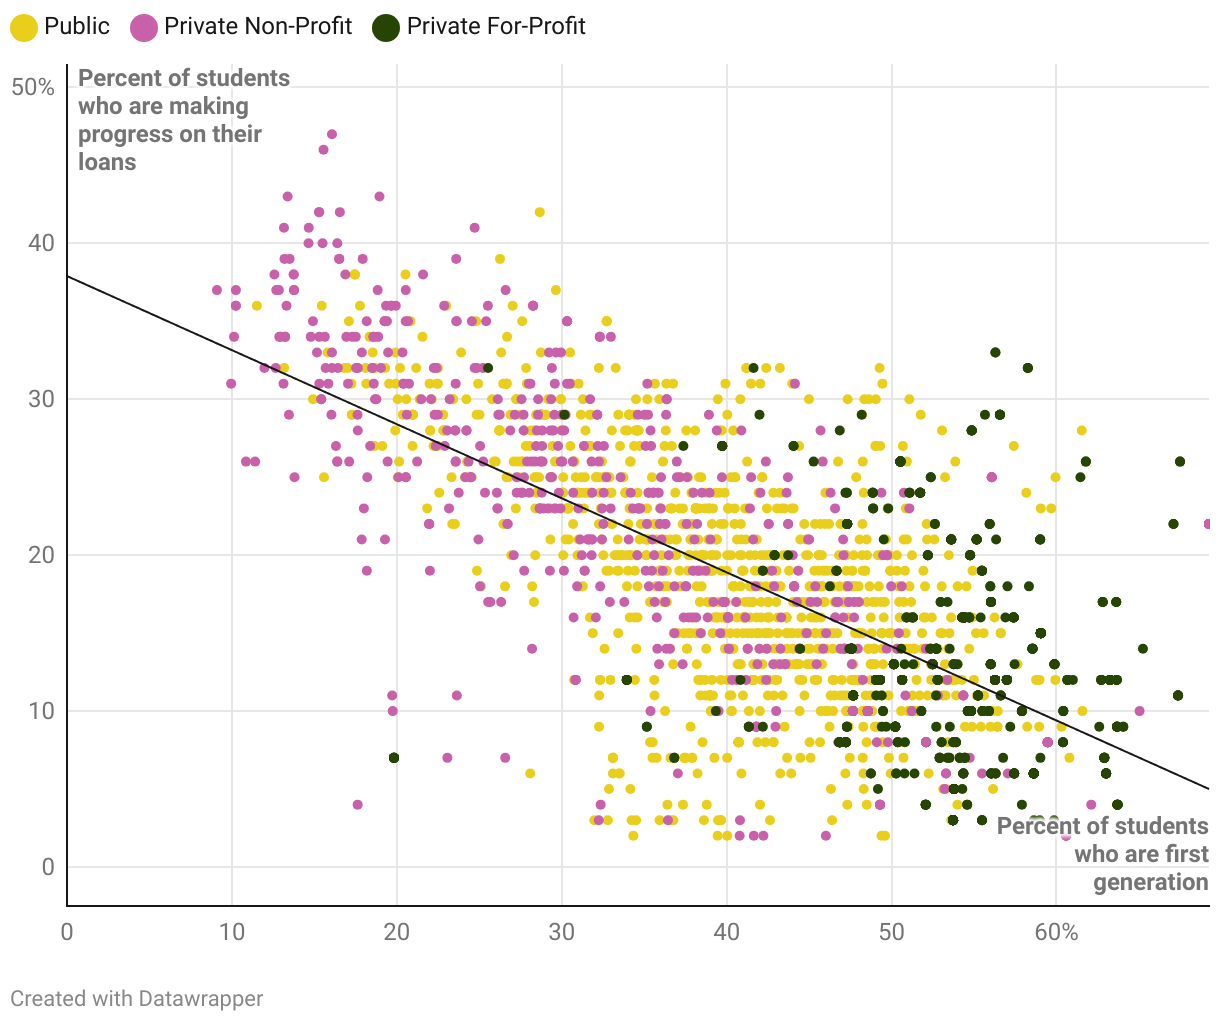
A scatter plot chart showing a correlation between schools’ repayment rates and the share of students who are first generation The higher the percent of first generation students, the lower the percent of students who are making progress on their loans after three years. The lower the percent of first generation students, the higher the percent of students who are making progress on their loans. Each dot in the scatter plot is a different school in the College Scorecard database.