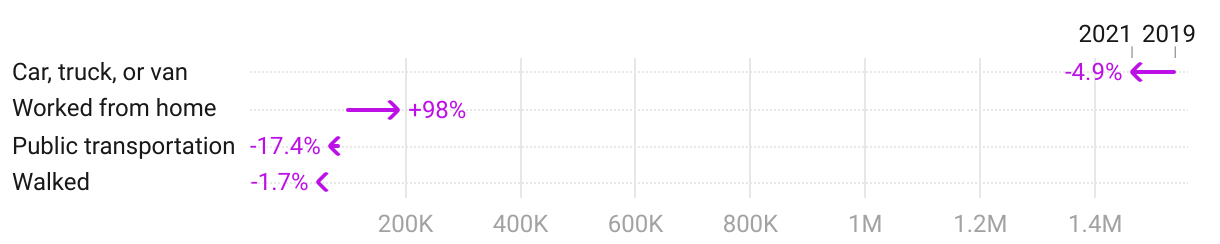
People working from home in CT almost doubled since 2019
The chart shows the various ways people get to work and how the amount has changed from 2019 to 2021 (most recent year with data available).
The chart shows the various ways people get to work and how the amount has changed from 2019 to 2021 (most recent year with data available).