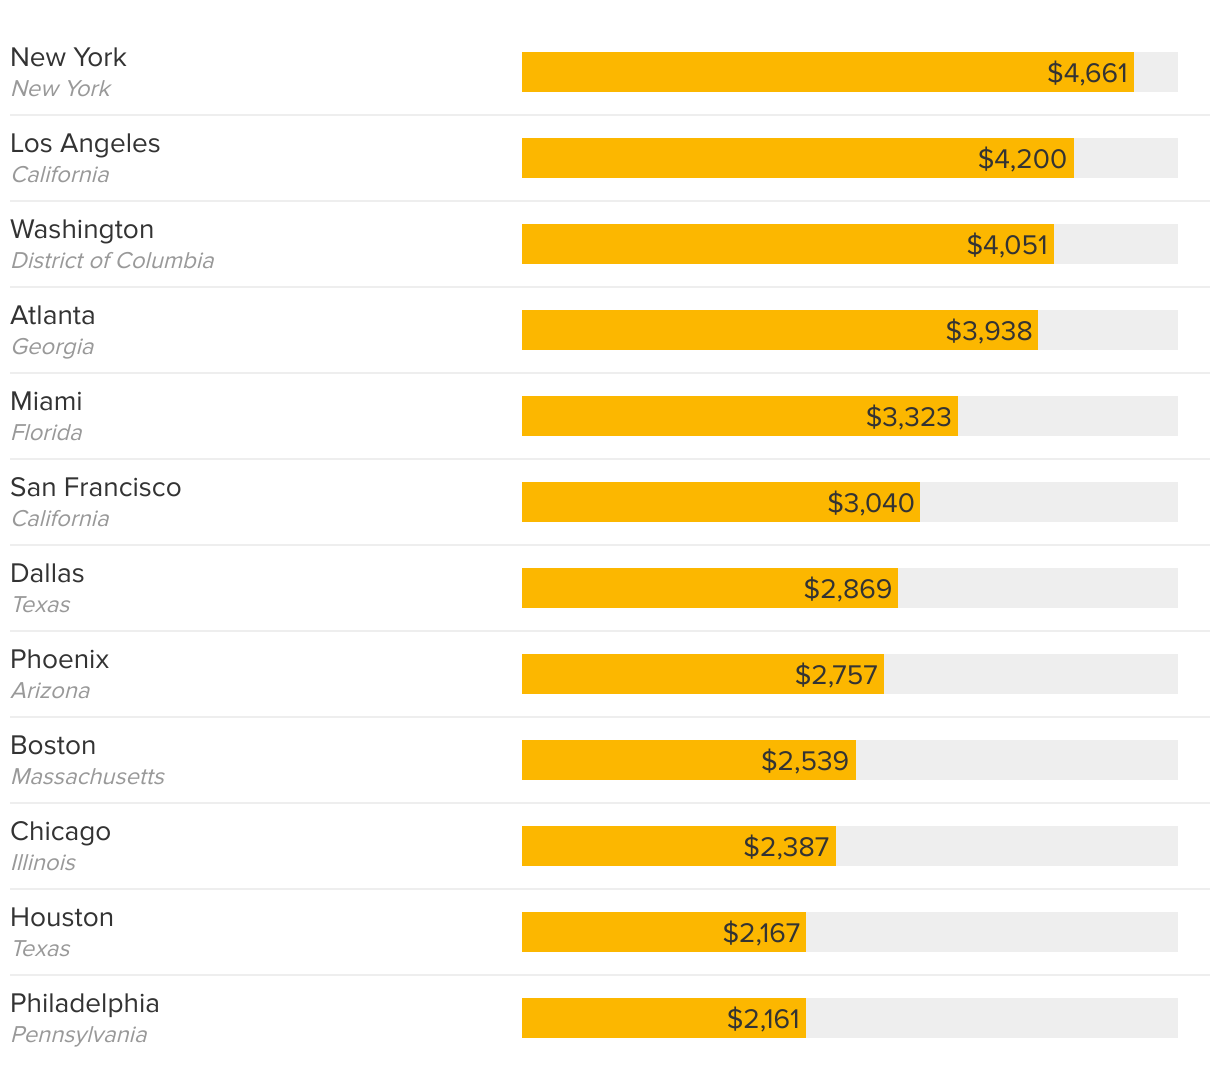
Fewer days at the office also means U.S. workers are spending a lot less
Estimated reduction in total spending at or near work for the year
The horizontal bar chart shows the estimated reduction in total spending at or near work for U.S. workers for a whole year.