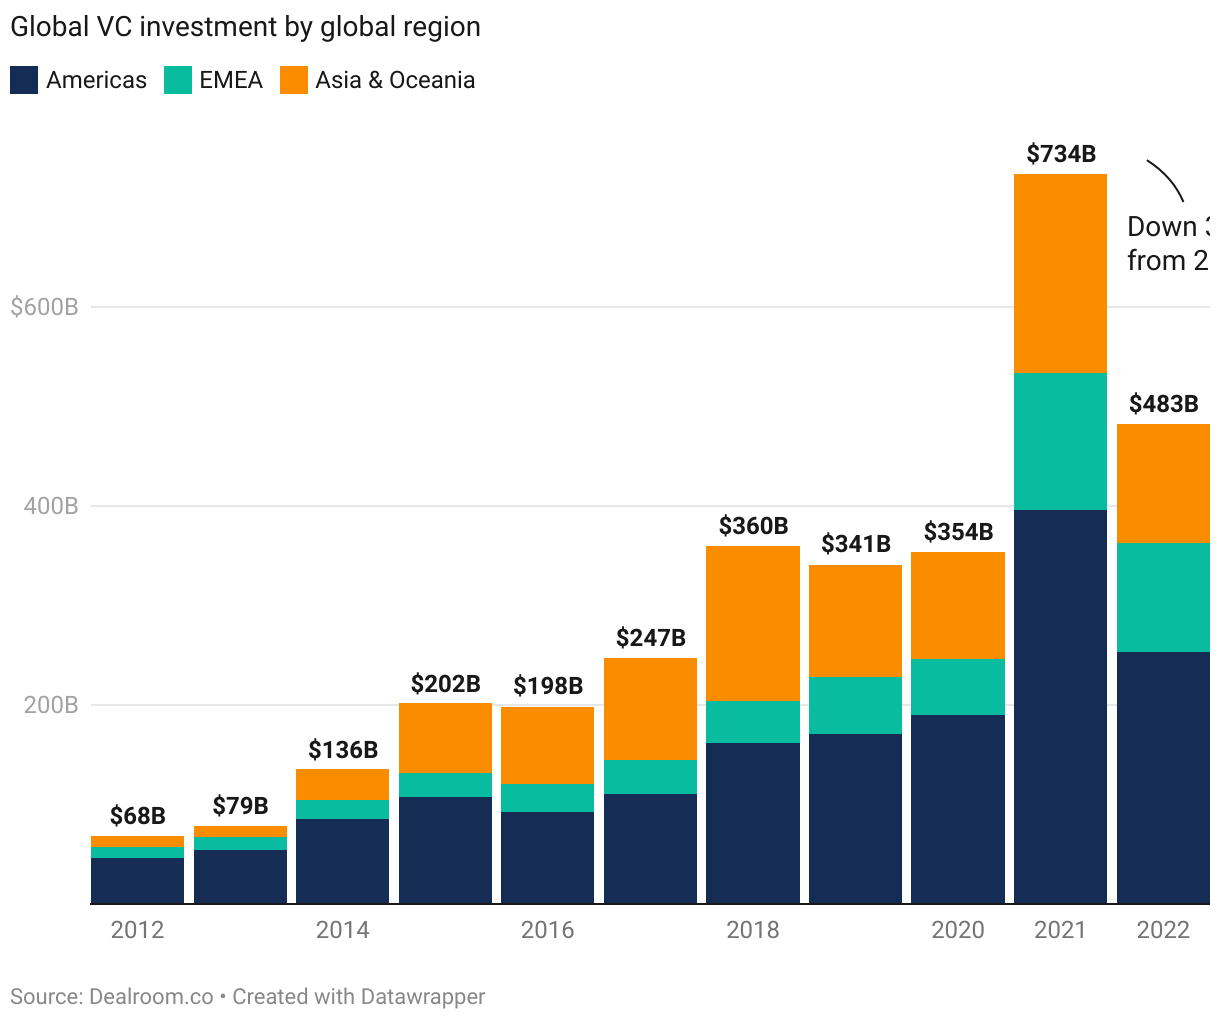
The following stacked column chart displays data from Dealroom.co on global venture capital (VC) investment by global region. The chart includes three regions: Americas, EMEA (Europe, Middle East, and Africa), and Asia & Oceania. The years covered in the chart range from 2012 to 2022. Each column represents a specific year, while the stacked segments within each column represent the corresponding VC investment amounts for the three regions. The figures are presented in billions and represent the total VC investment in each region for the respective year. The chart provides a visual representation of the trends and patterns in VC investment across different global regions over the specified time period.
Global VC investment by global region
