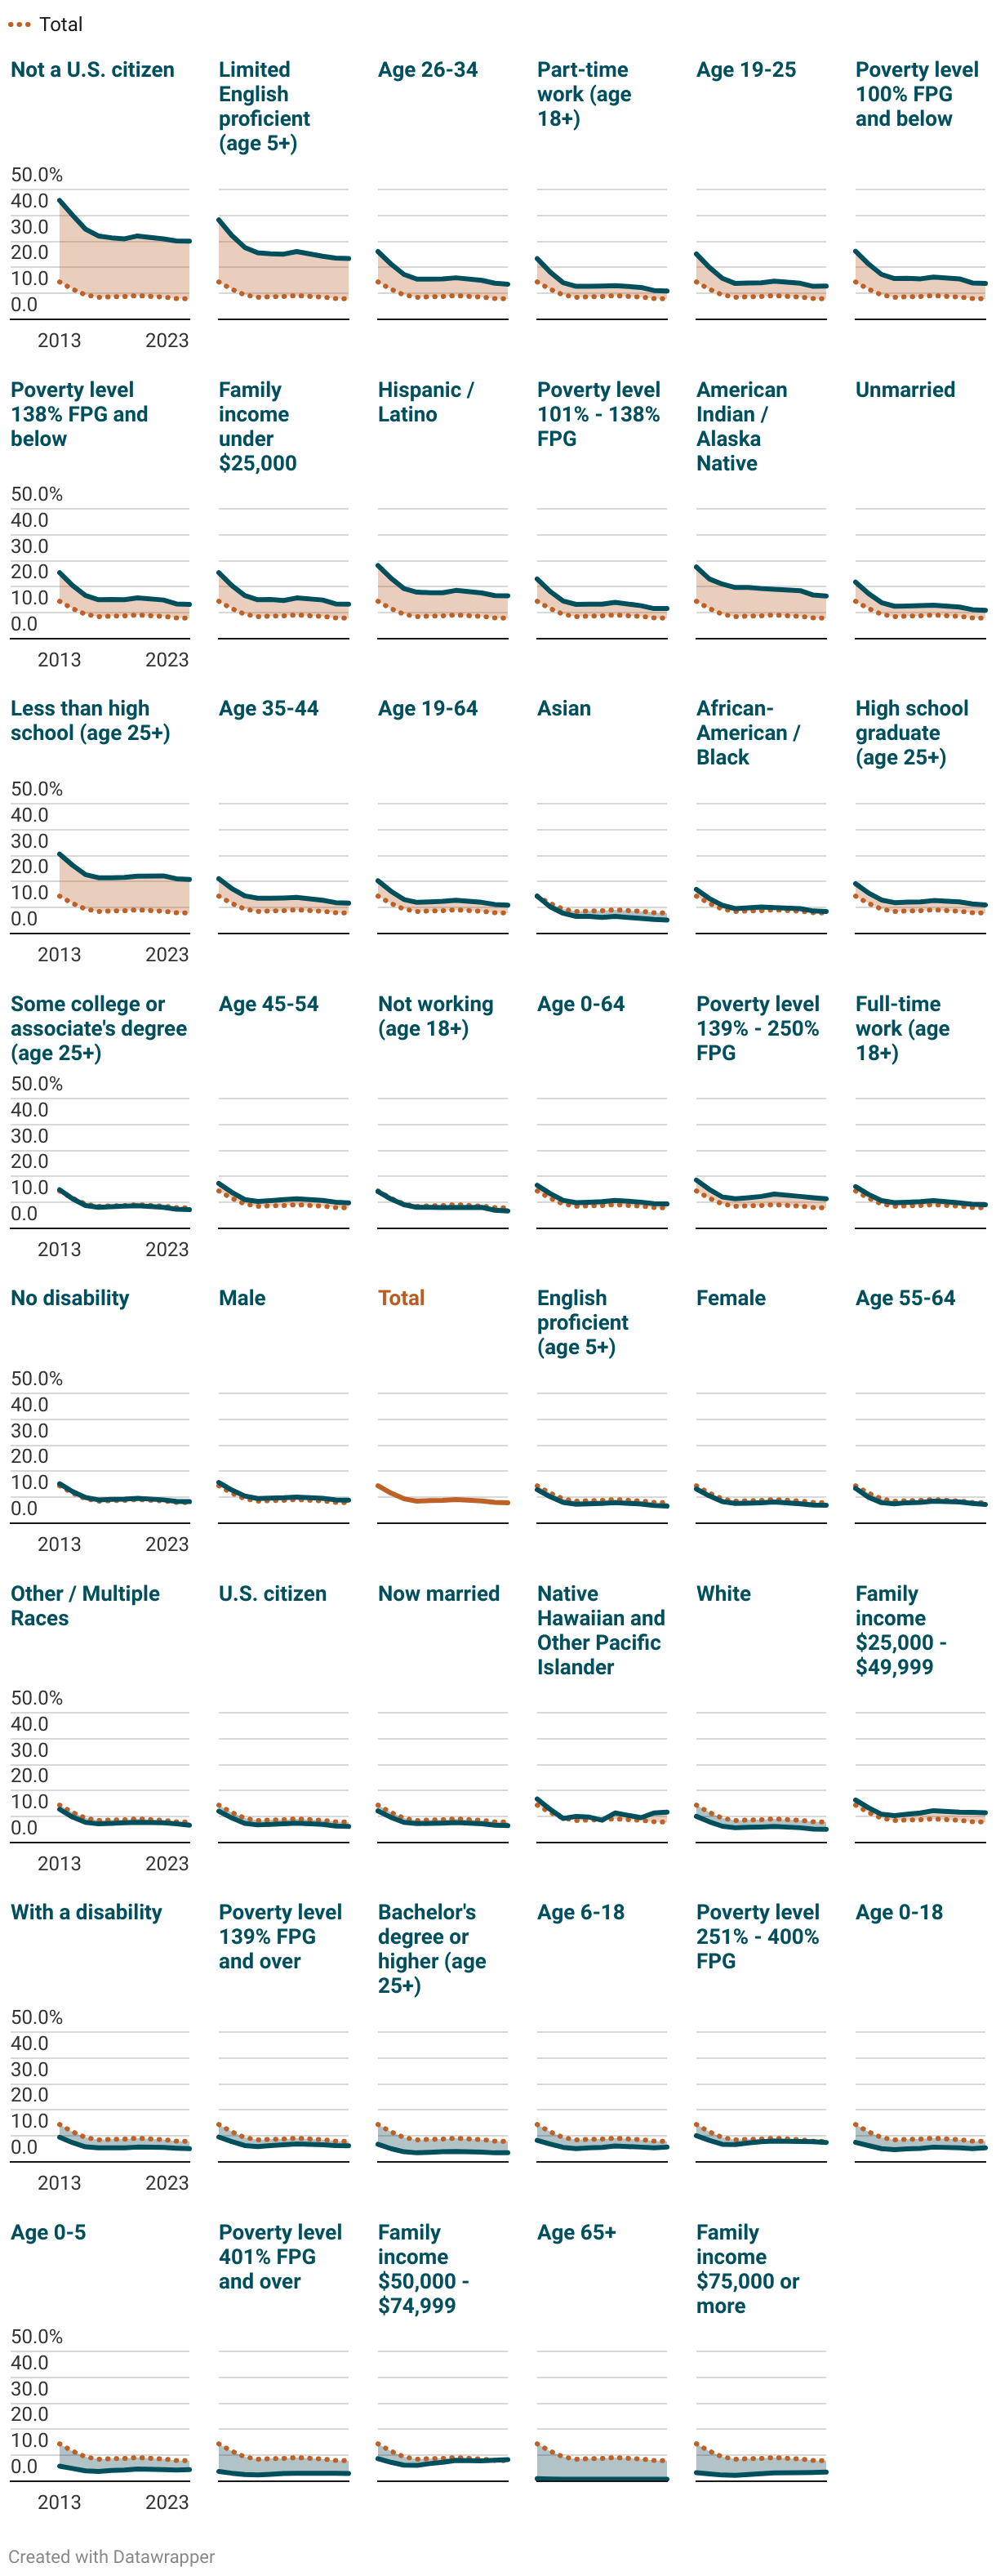
Uninsurance Fell for Most Groups of Americans Under the Affordable Care Act
Annual trends in U.S. rates of uninsurance by subpopulation (vs. total) sorted by percentage point change, 2013–2023
Graph shows trends in U.S. uninsured rates from 2013 to 2023 by various subpopulations, including age, income and poverty level, limited English proficiency, citizenship, marital status, work, education, gender, race and ethnicity, and disability status.