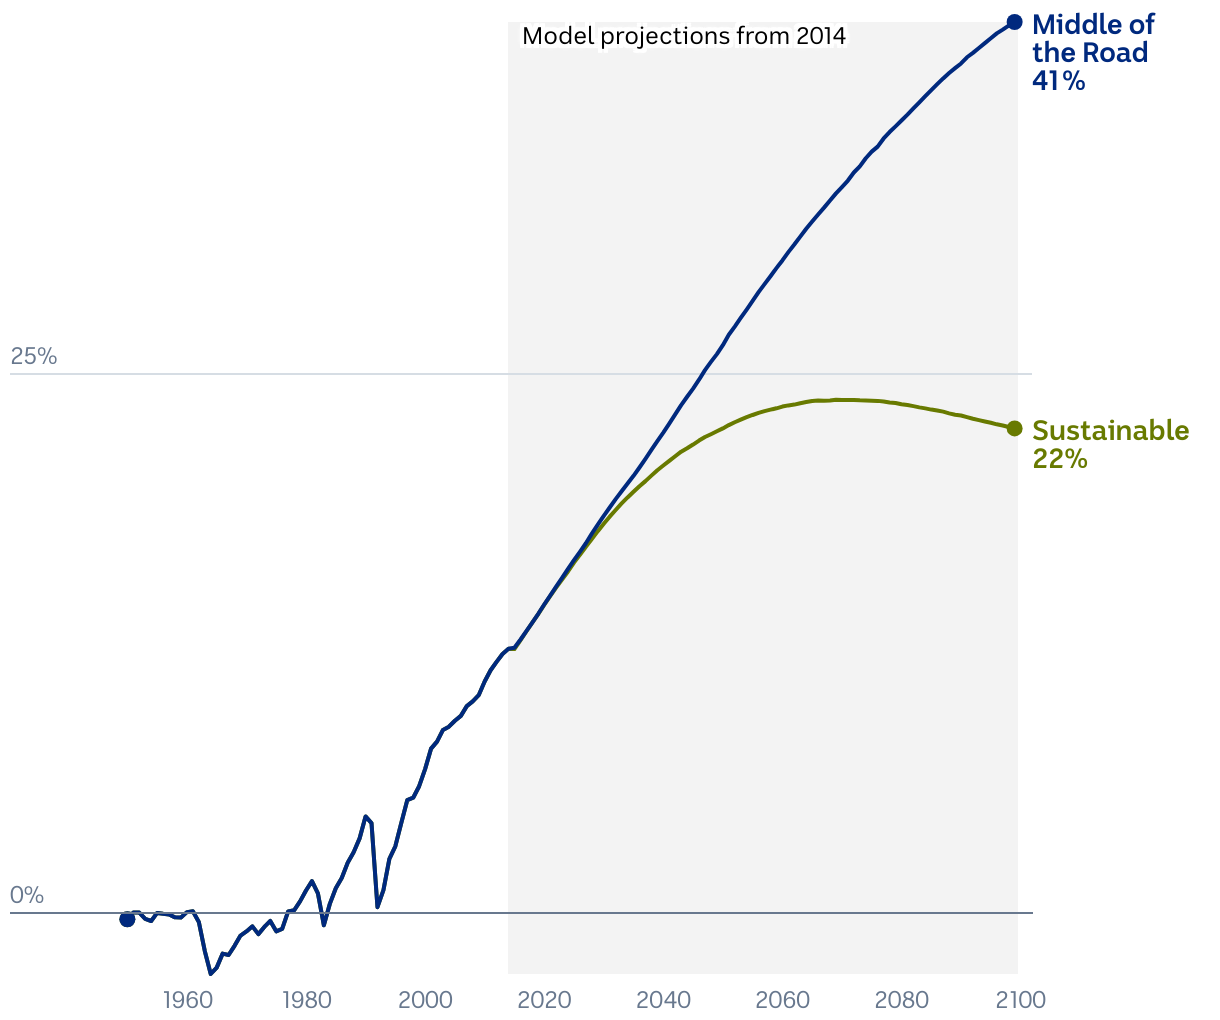
Change in extreme rainfall in one-hour periods 1950-2099
Applying different climate scenarios, these graphs model the probable percentage increase in the magnitude of flash flood events.
Applying different climate scenarios, these graphs model the probable percentage increase in the magnitude of flash flood events.