Suspensions per 100 state school pupils, by decile of deprivation, 2015–16 to 2023–24

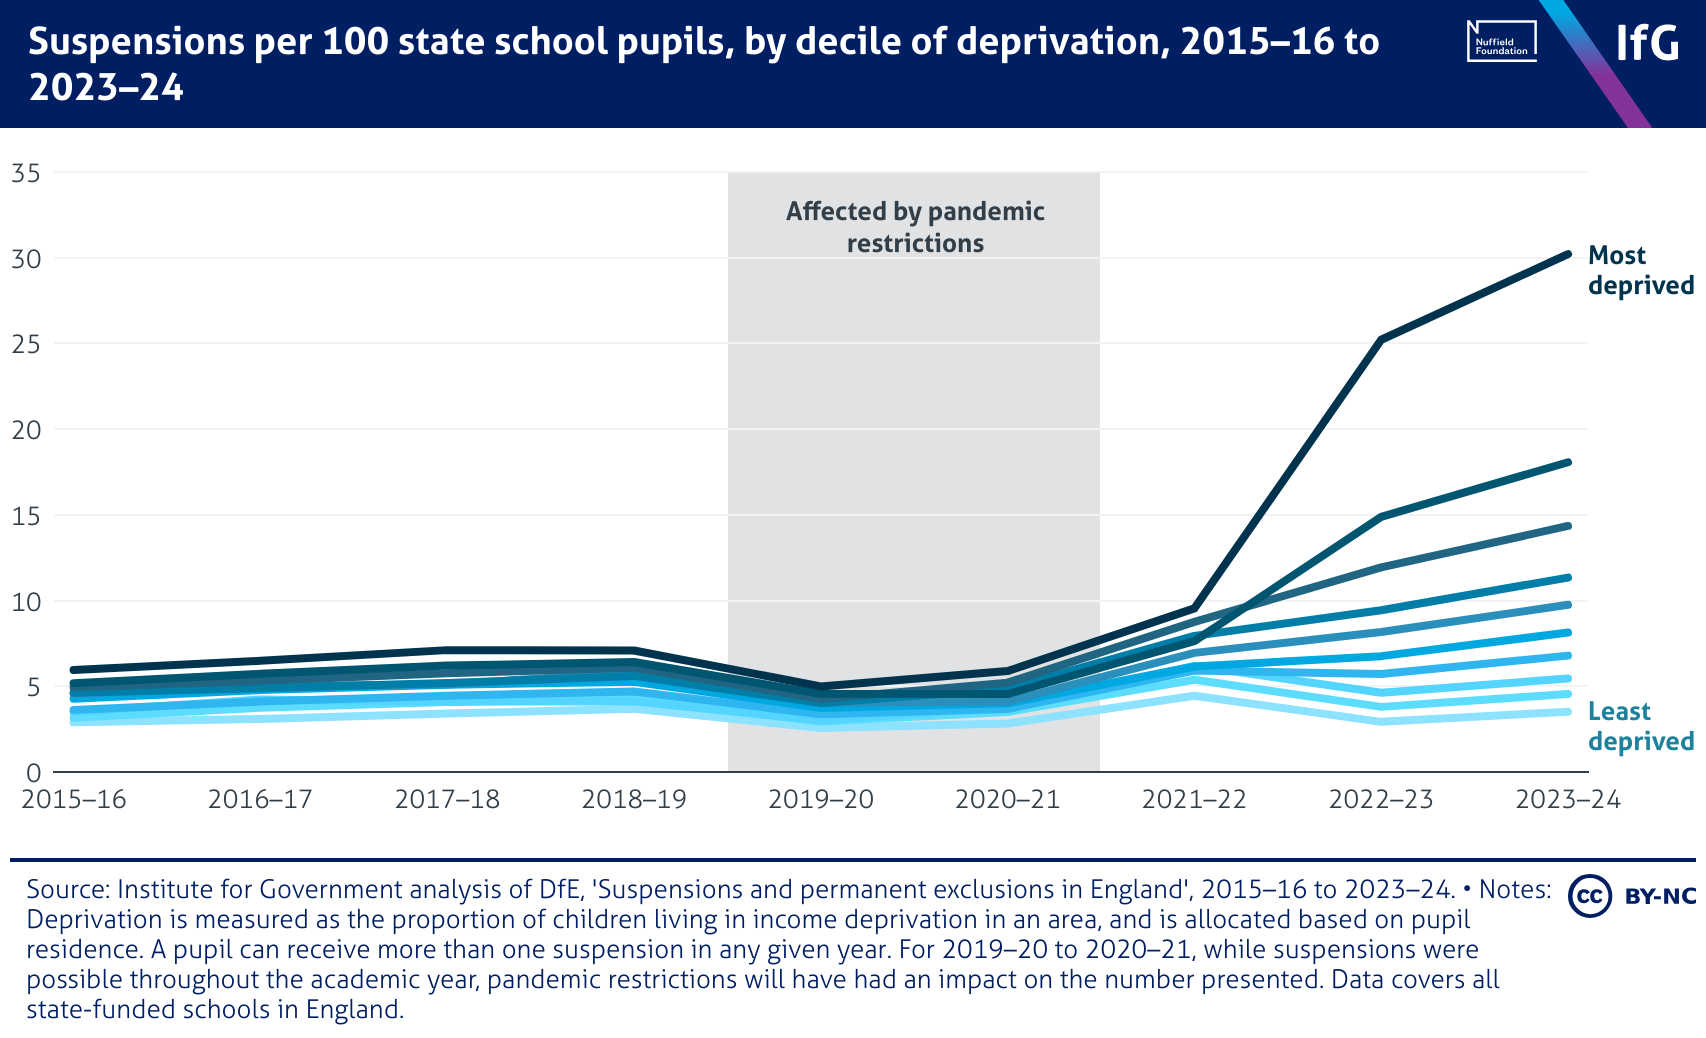
A line chart from the Institute for Government of suspensions per 100 state school pupils, by decile of deprivation, 2015–16 to 2023–24, where the disparity between pupils living in the most and least deprived areas has grown nearly eight times in size since the pandemic. In 2023–24, suspensions were ten times more common among pupils living in the most deprived areas than among those in the least deprived areas, at a rate of 30.2 versus 3.5 per 100.

