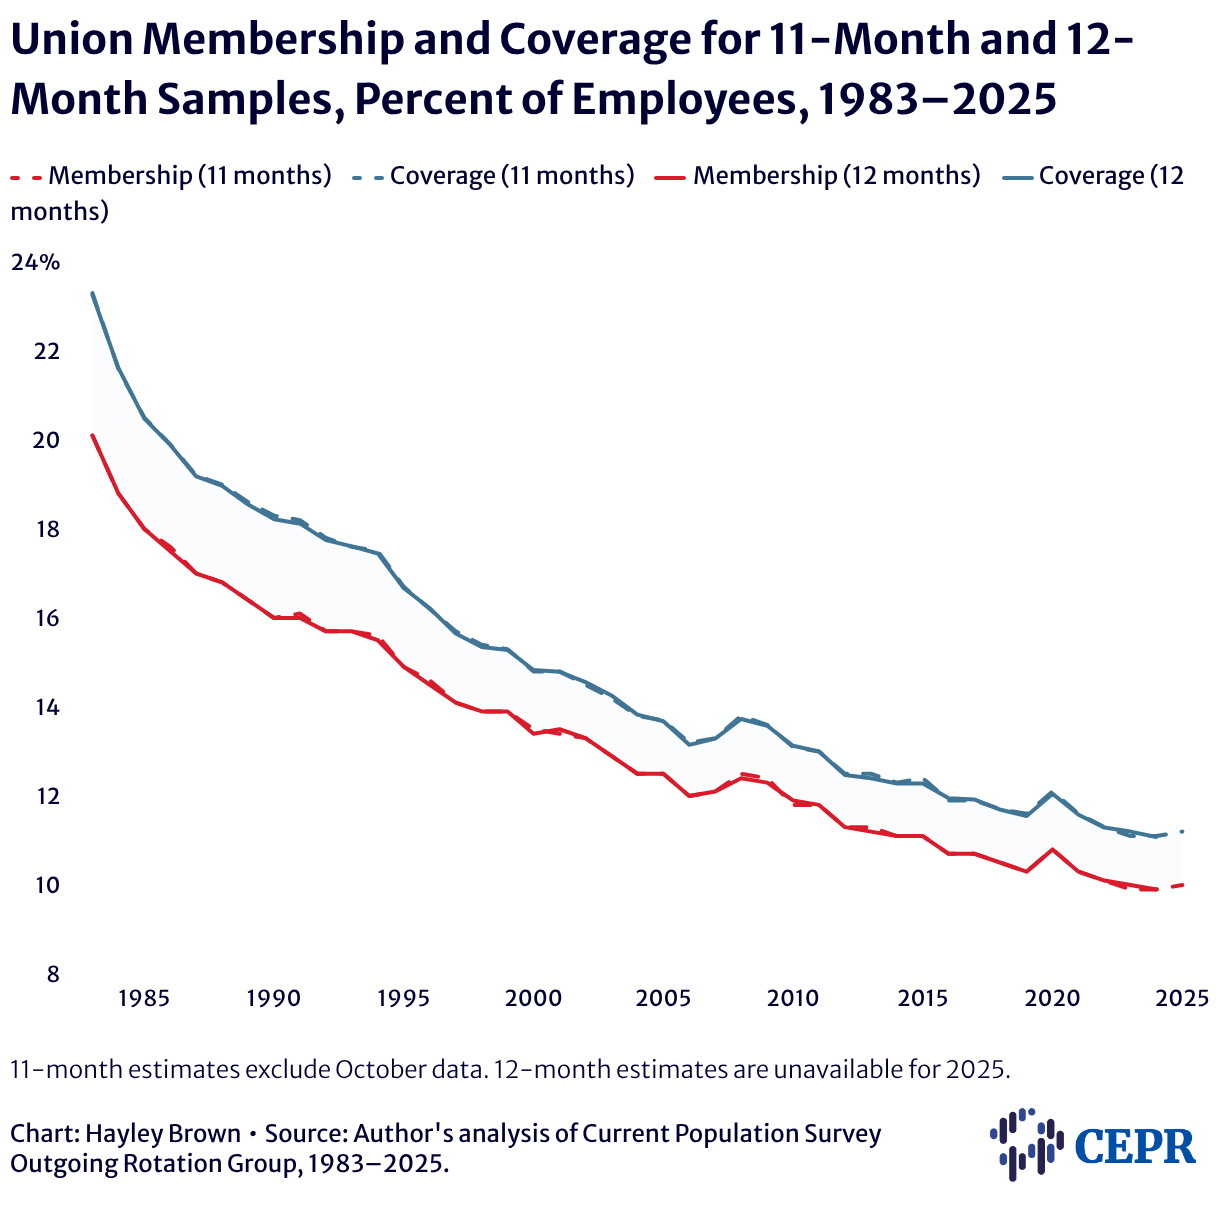
Union Membership and Coverage for 11-Month and 12-Month Samples, Percent of Employees, 1983–2025
Line chart showing overall US union membership (red lines) and coverage (blue lines) density from 1983 through 2025 for both 11-month samples (dotted lines) and 12-month samples (solid lines). Both membership and coverage density declined substantially during this time period, and the 11-month and 12-month samples are within 0.1 percentage points of each other during this period.

11-month estimates exclude October data. 12-month estimates are unavailable for 2025.