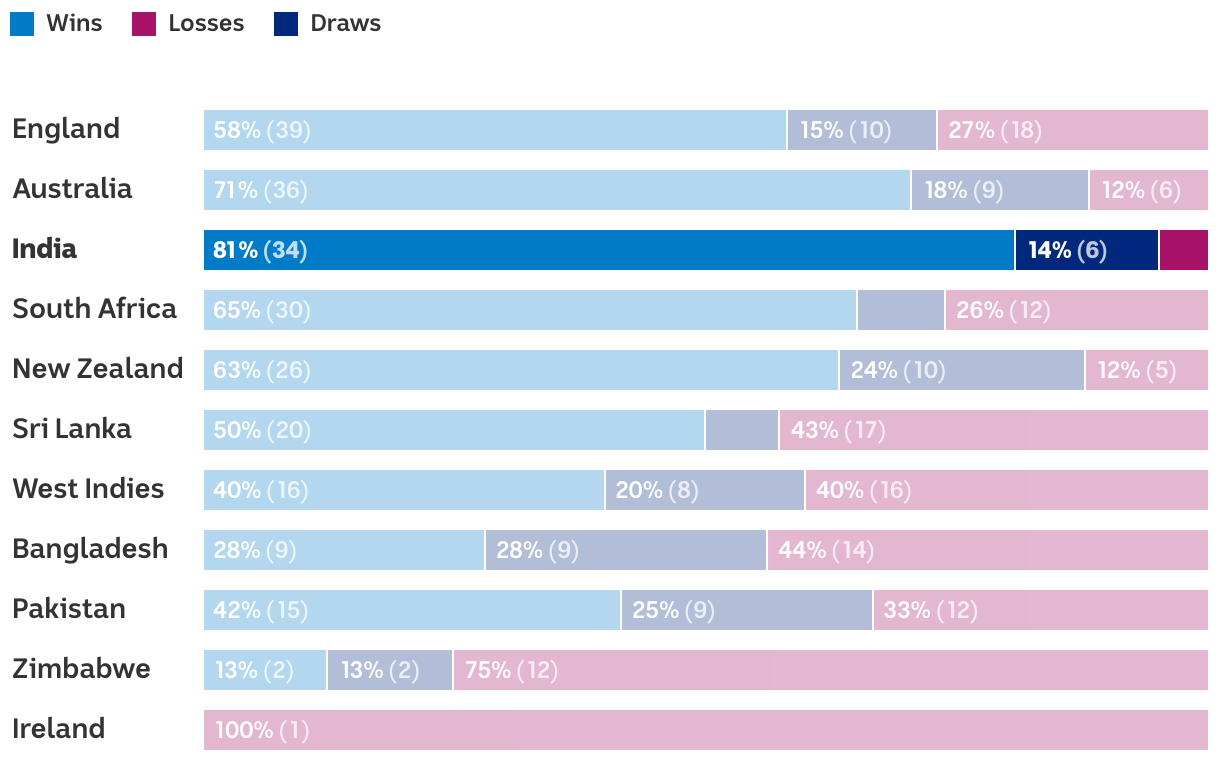
Record of Test playing nations at home since February 1, 2013
A graph showing the win/loss/draw record of teams in Test matches at home in the last 10 years.
Wins
Losses
Draws
England
58%
(39)
15%
(10)
27%
(18)
Australia
71%
(36)
18%
(9)
12%
(6)
India
81%
(34)
14%
(6)
4.8%
(2)
South Africa
65%
(30)
9%
(4)
26%
(12)
New Zealand
63%
(26)
24%
(10)
12%
(5)
Sri Lanka
50%
(20)
8%
(3)
43%
(17)
West Indies
40%
(16)
20%
(8)
40%
(16)
Bangladesh
28%
(9)
28%
(9)
44%
(14)
Pakistan
42%
(15)
25%
(9)
33%
(12)
Zimbabwe
13%
(2)
13%
(2)
75%
(12)
Ireland
0%
(0)
0%
(0)
100%
(1)