Patients that have a preferred GP* and frequency of seeing that GP, 2012–25

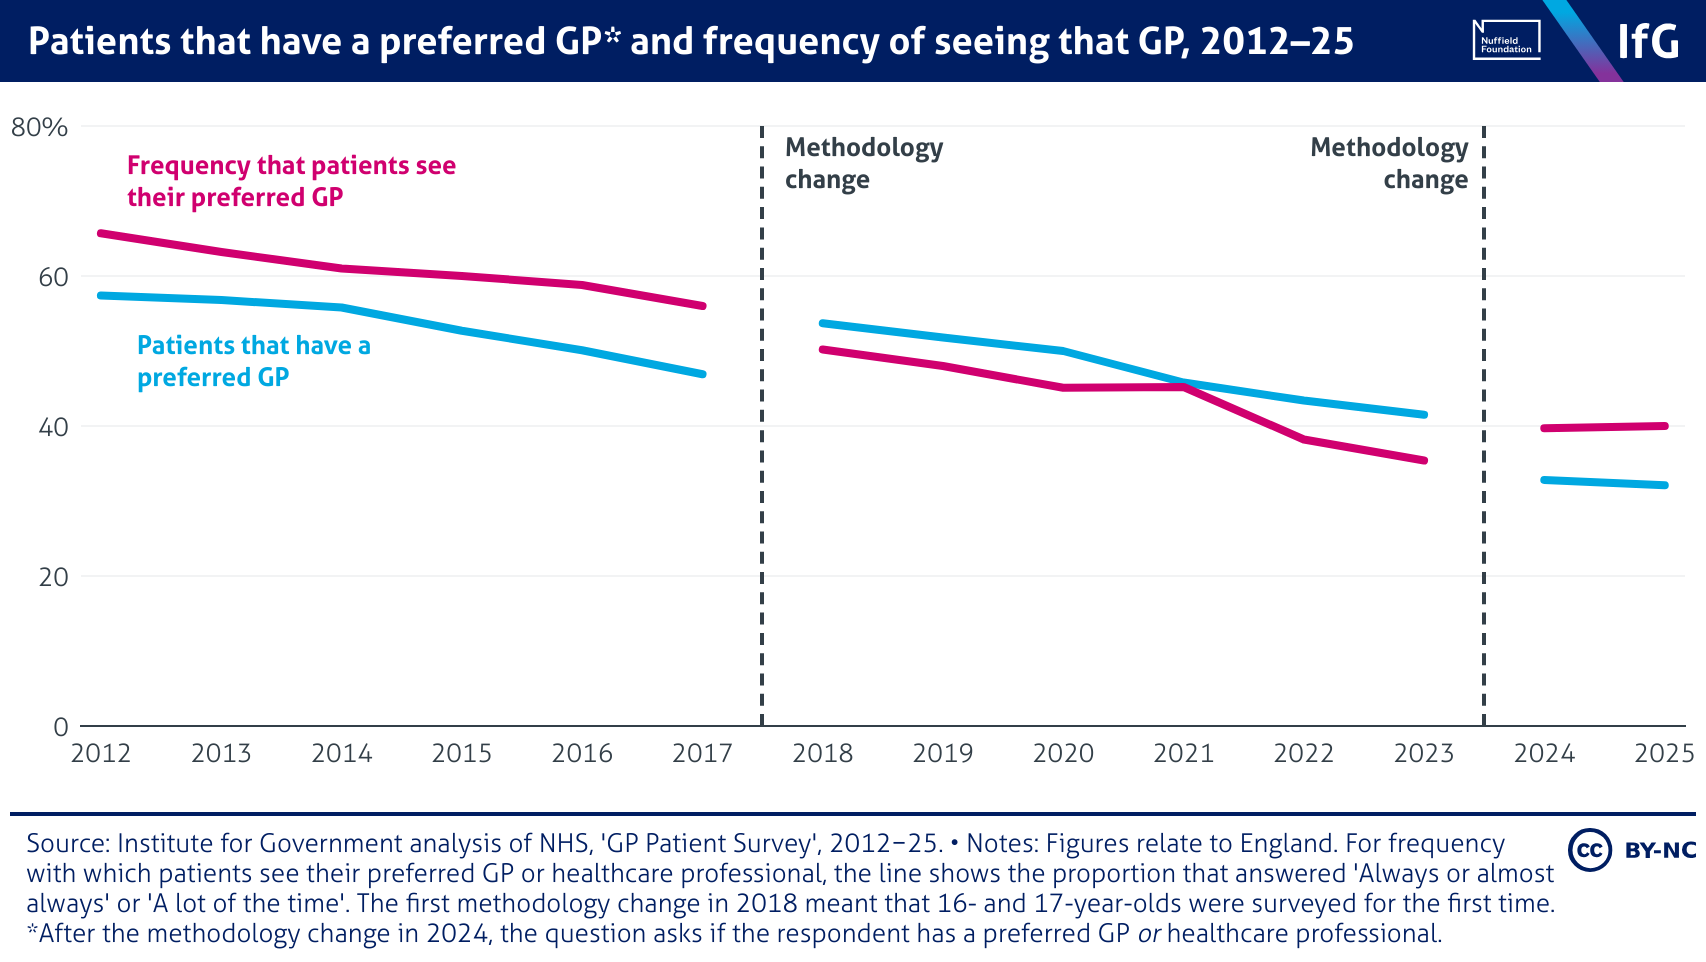
A line chart from the Institute for Government showing patients that have a preferred GP and the frequency of seeing that GP, 2012–25. Both measures have declined steadily over time. In 2017, 46.9% of patients had a preferred GP and 56% usually saw them, but by 2023 these figures had dropped to 41.5% and 35.4% respectively. Following the 2024 methodology change, results show a slight stabilisation, with around 32% having a preferred professional and 40% seeing them regularly in 2025.

