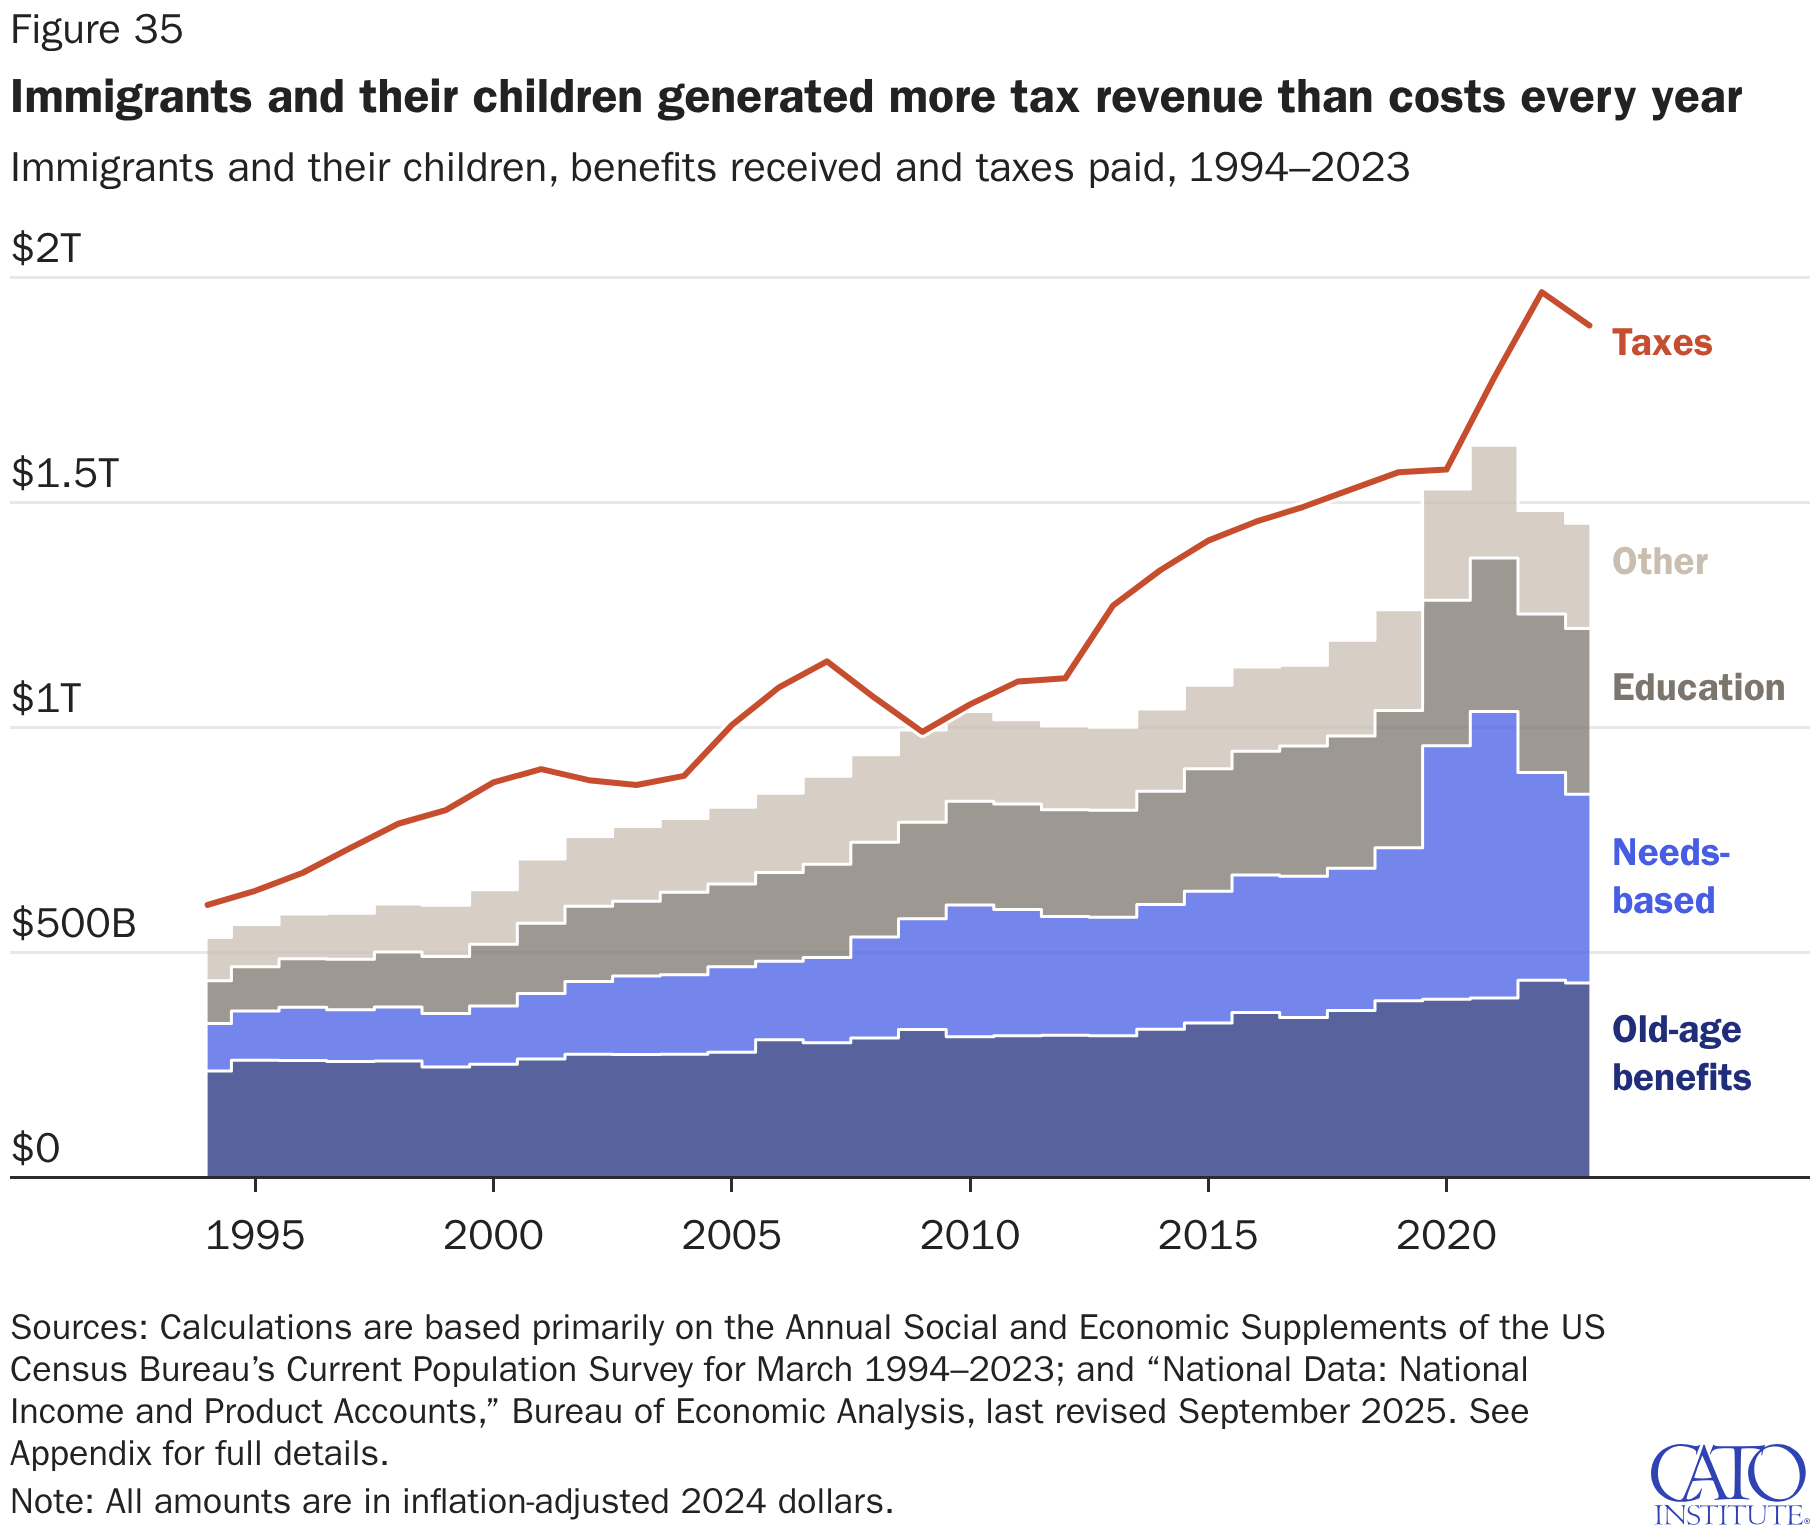
Immigrants and their children, benefits received and taxes paid, 1994–2023
(Please use a modern browser to see the interactive version of this visualization)
