How will the design engineering work for each of these EV powertrain electronics be handled 10+ years from now?
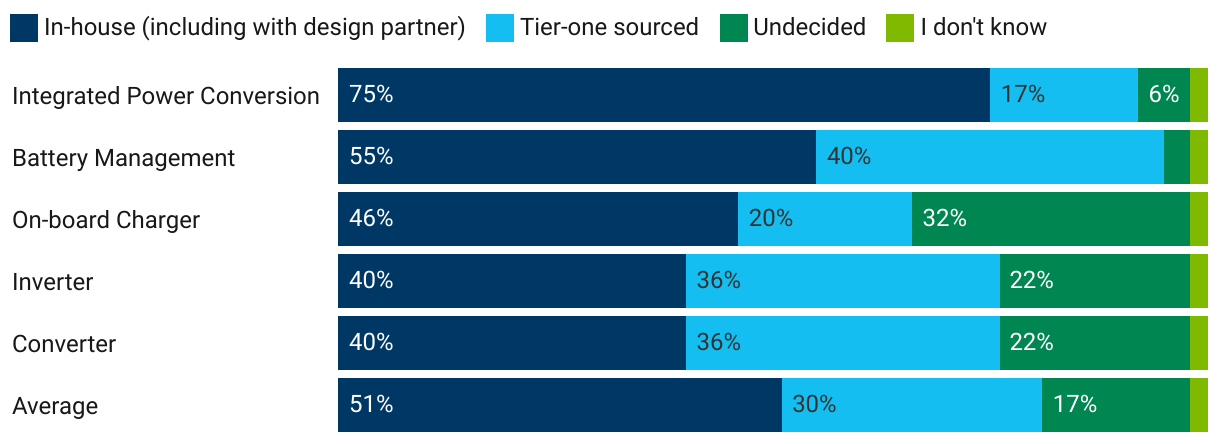
Stacked bar chart titled "How will the design engineering work for each of these EV powertrain electronics be handled 10+ years from now?" The bars titled "in-house (including with design partner)" dark blue, the bars titled "tier-one sourced" are light blue, the bars titled "undecided" are dark green and the bars titled "I don't know" are light green. The data is as follows:
Integrated power conversion: 75% in-house including with design partner, 17% tier-one sourced, 6% undecided, 2% I don't know. Battery management: 55% in-house including with design partner, 40% tier-one sourced, 3% undecided, 2% I don't know. On-board charger: 46% in-house including with design partner, 20% tier-one sourced, 32% undecided, 2% I don't know. Inverter: 40% in-house including with design partner, 36% tier-one sourced, 22% undecided, 2% I don't know. Converter: 40% in-house including with design partner, 36% tier-one sourced, 22% undecided, 2% I don't know. Average: 51% in house including with design partner, 30% tier-one sourced, 17% undecided, 2% I don't know.