Completely Open Centers
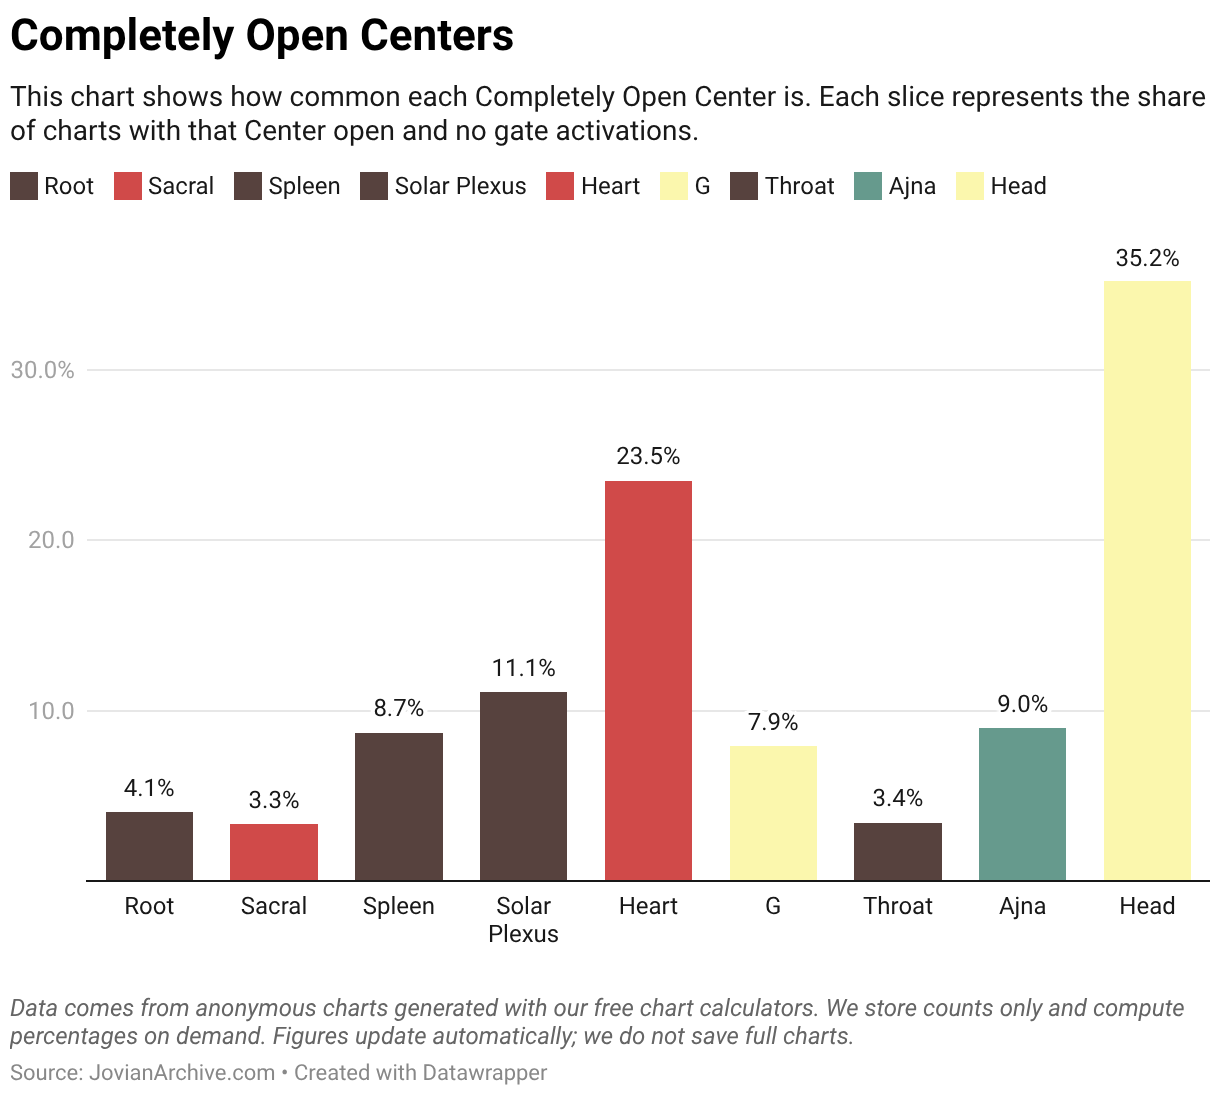
This chart shows how common each Completely Open Center is. Each slice represents the share of charts with that Center open and no gate activations.
This chart shows how common each Completely Open Center is. Each slice represents the share of charts with that Center open and no gate activations.
