Angel Tax Credits and Young High-Tech Firm Outcomes
Difference between firms in states with and without angel
tax credit programs, relative to year before implementation
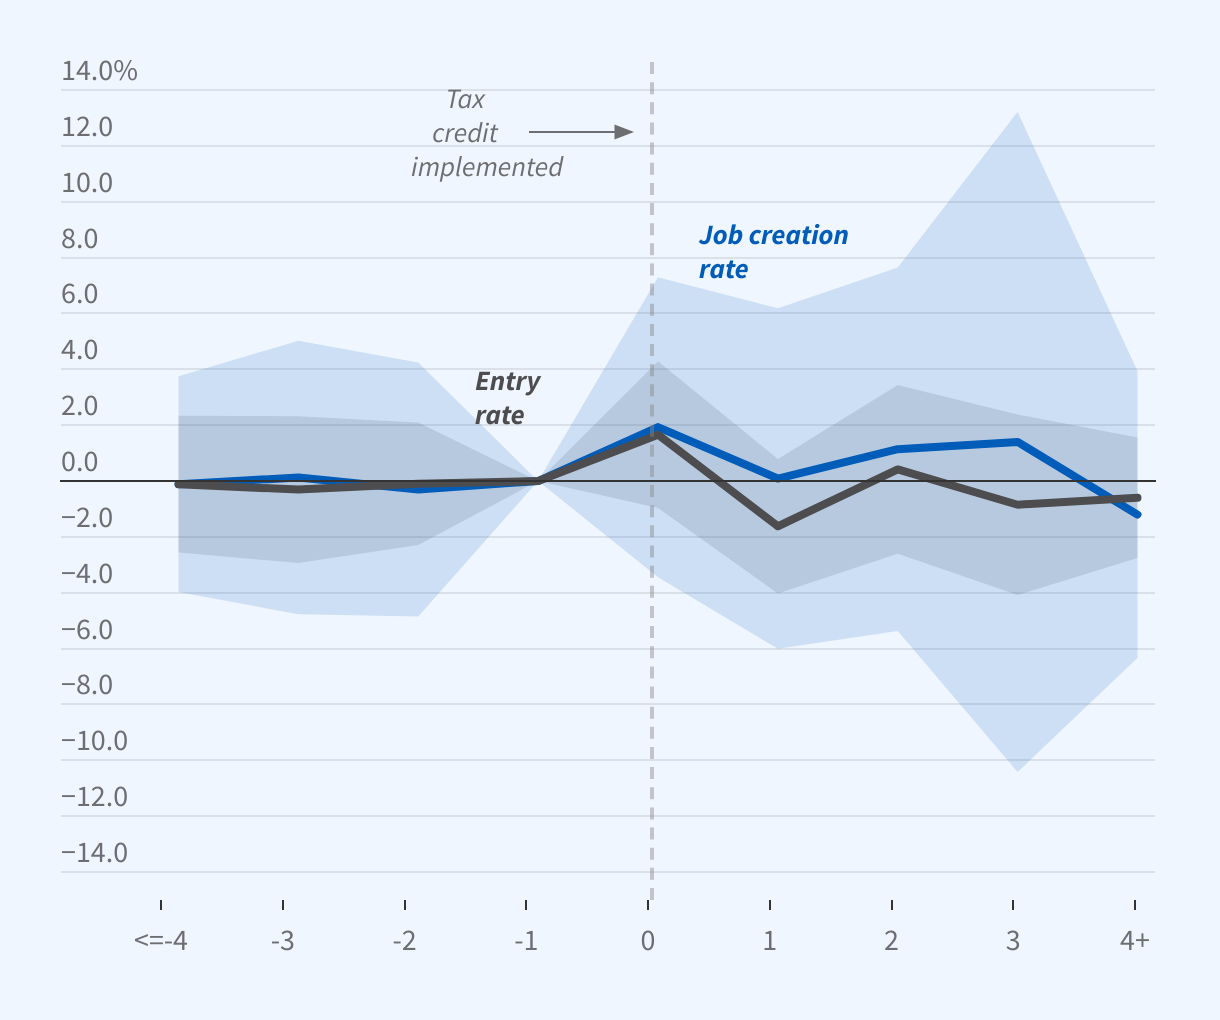
The graph is an event-study chart titled, “Angel Tax Credits and Young High-Tech Firm Outcomes.”
The chart plots estimates of the difference in both the entry and job creation rate between firms in states with and without angel tax credit programs, relative to the year before implementation.
The y-axis ranges from -15 to 15 percent, and the x-axis ranges from 4 or more years before and 4 or more years after implementation.
Estimates for both outcome variables are not statistically significantly different from zero.
Source: Denes M, Howell S, Mezzanotti F, Wang X, Xu T. NBER Working Paper 27751, and forthcoming in the Journal of Finance