How collision rates per 1,000 people in Waterloo for both pedestrians and cyclists have changed since 2015
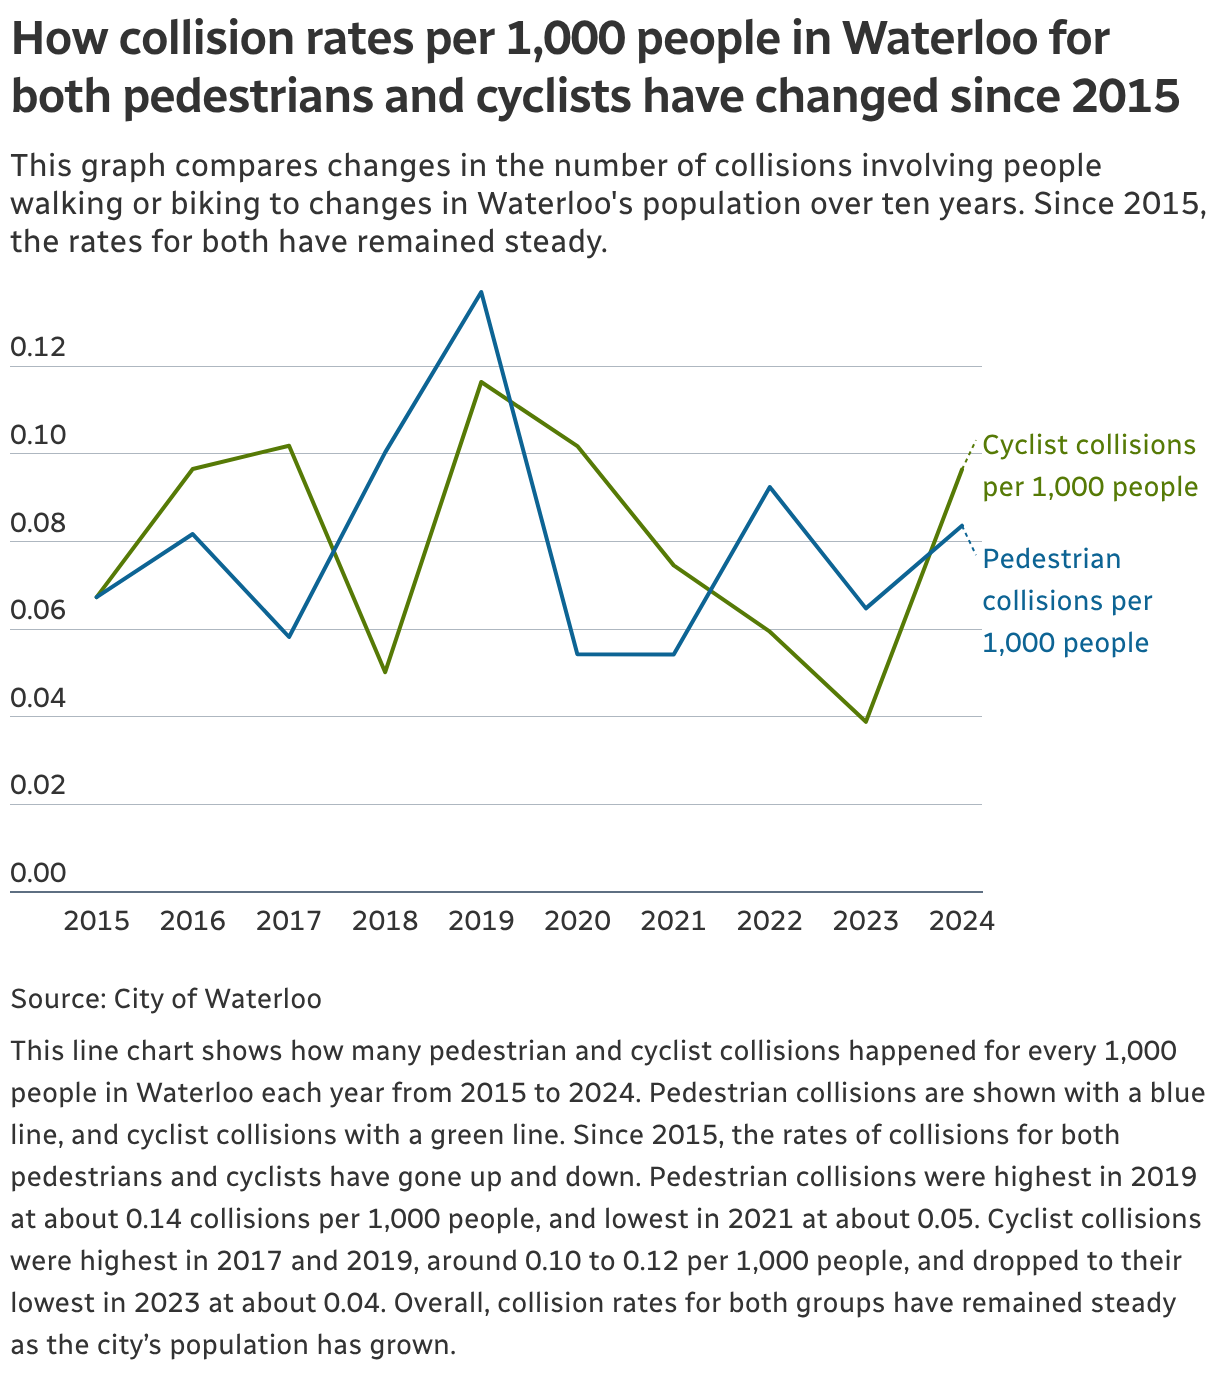
This graph compares changes in the number of collisions involving people walking or biking to changes in Waterloo's population over ten years. Since 2015, the rates for both have remained steady.
This line chart shows how many pedestrian and cyclist collisions happened for every 1,000 people in Waterloo each year from 2015 to 2024. Pedestrian collisions are shown with a blue line, and cyclist collisions with a green line. Since 2015, the rates of collisions for both pedestrians and cyclists have gone up and down. Pedestrian collisions were highest in 2019 at about 0.14 collisions per 1,000 people, and lowest in 2021 at about 0.05. Cyclist collisions were highest in 2017 and 2019, around 0.10 to 0.12 per 1,000 people, and dropped to their lowest in 2023 at about 0.04. Overall, collision rates for both groups have remained steady as the city’s population has grown.
