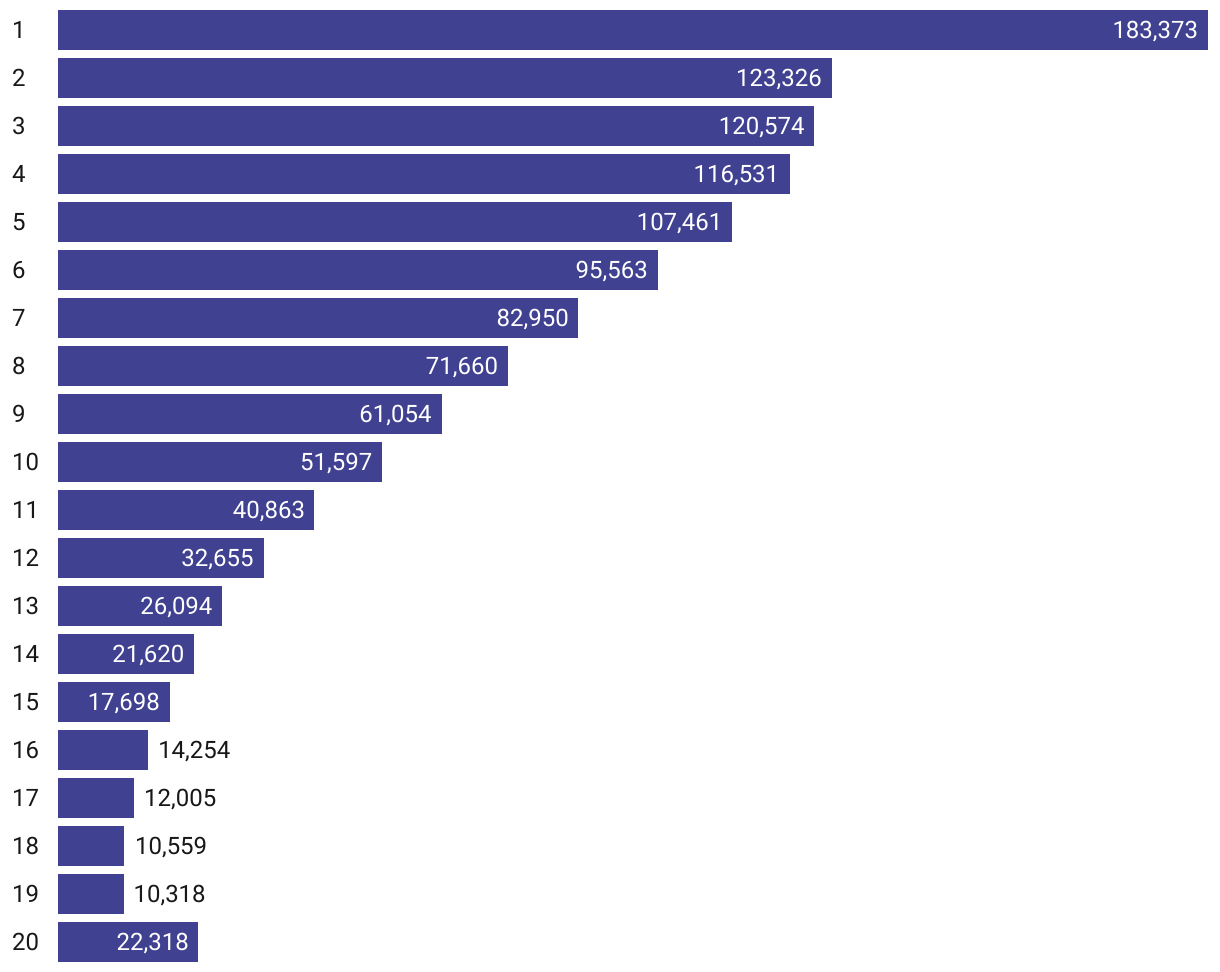
A line graph shows the distribution of the number of students who submitted between one and 20 college applications. It is skewed toward a lower number of applications with a slight uptick in the number of students submitting 20.
(Please use a modern browser to see the interactive version of this visualization)