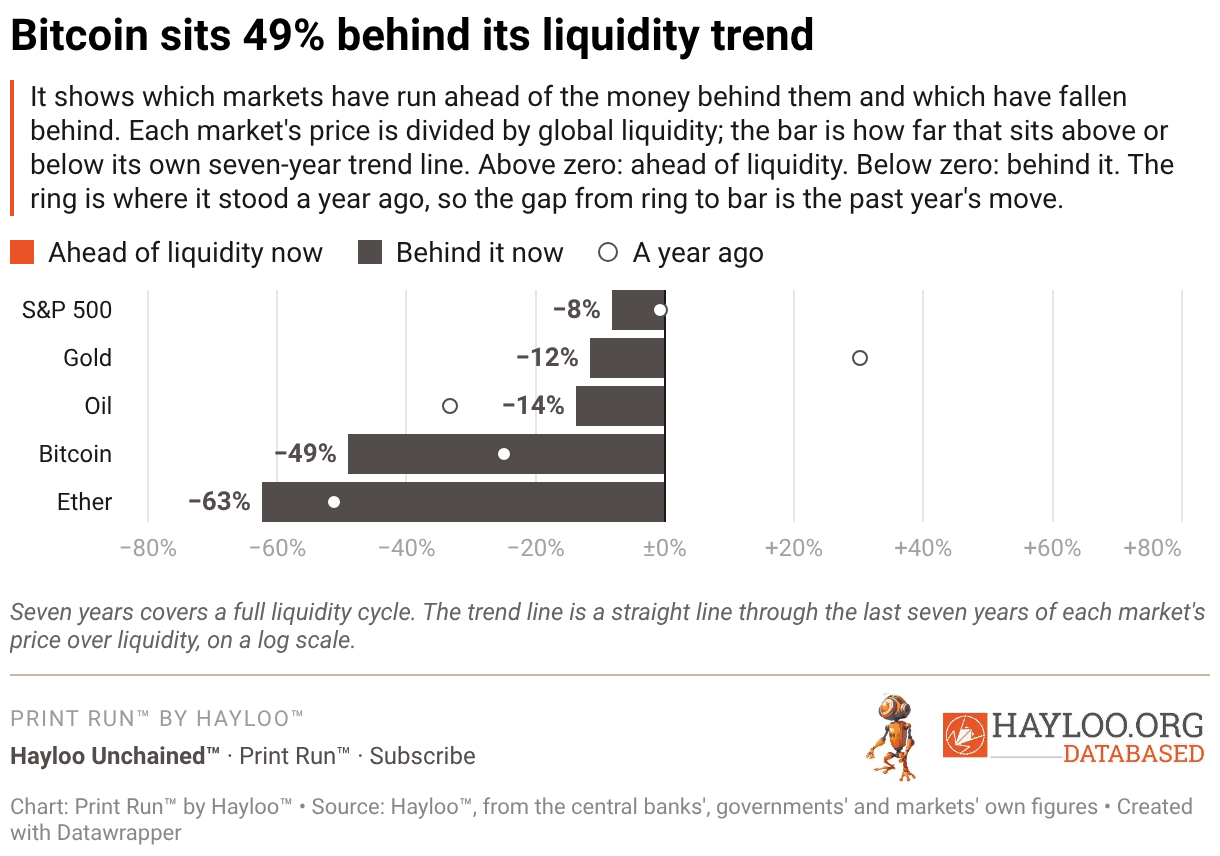
Bitcoin sits 49% behind its liquidity trend
It shows which markets have run ahead of the money behind them and which have fallen behind. Each market's price is divided by global liquidity; the bar is how far that sits above or below its own seven-year trend line. Above zero: ahead of liquidity. Below zero: behind it. The ring is where it stood a year ago, so the gap from ring to bar is the past year's move. Ahead of liquidity now Behind it now A year ago