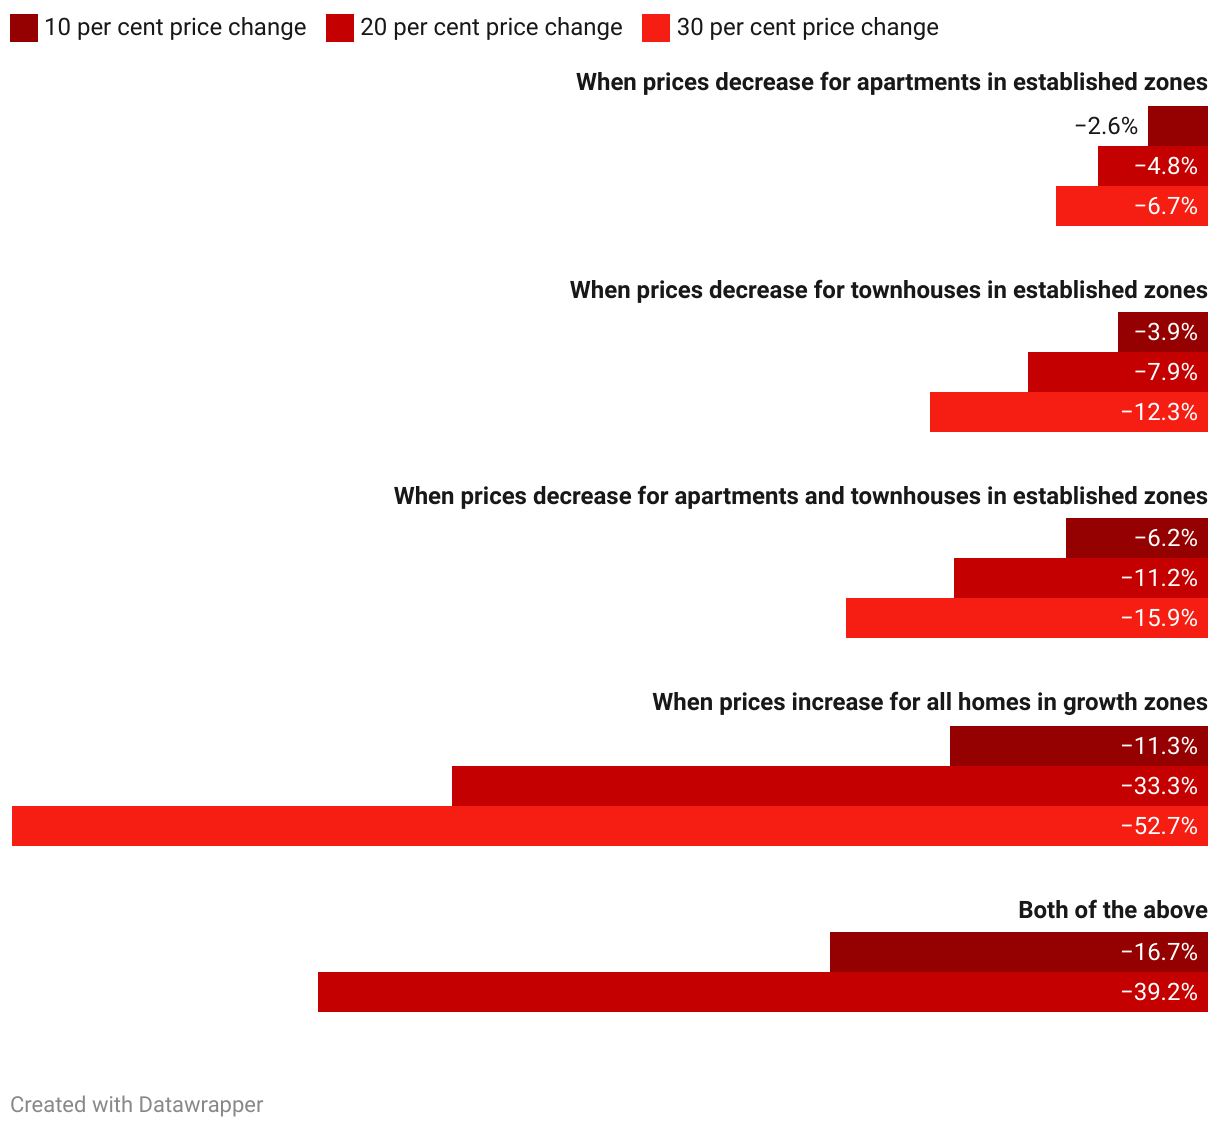
Figure 3: Change in demand for homes in Melbourne growth areas in response to changes in relative prices
(Please use a modern browser to see the interactive version of this visualization)