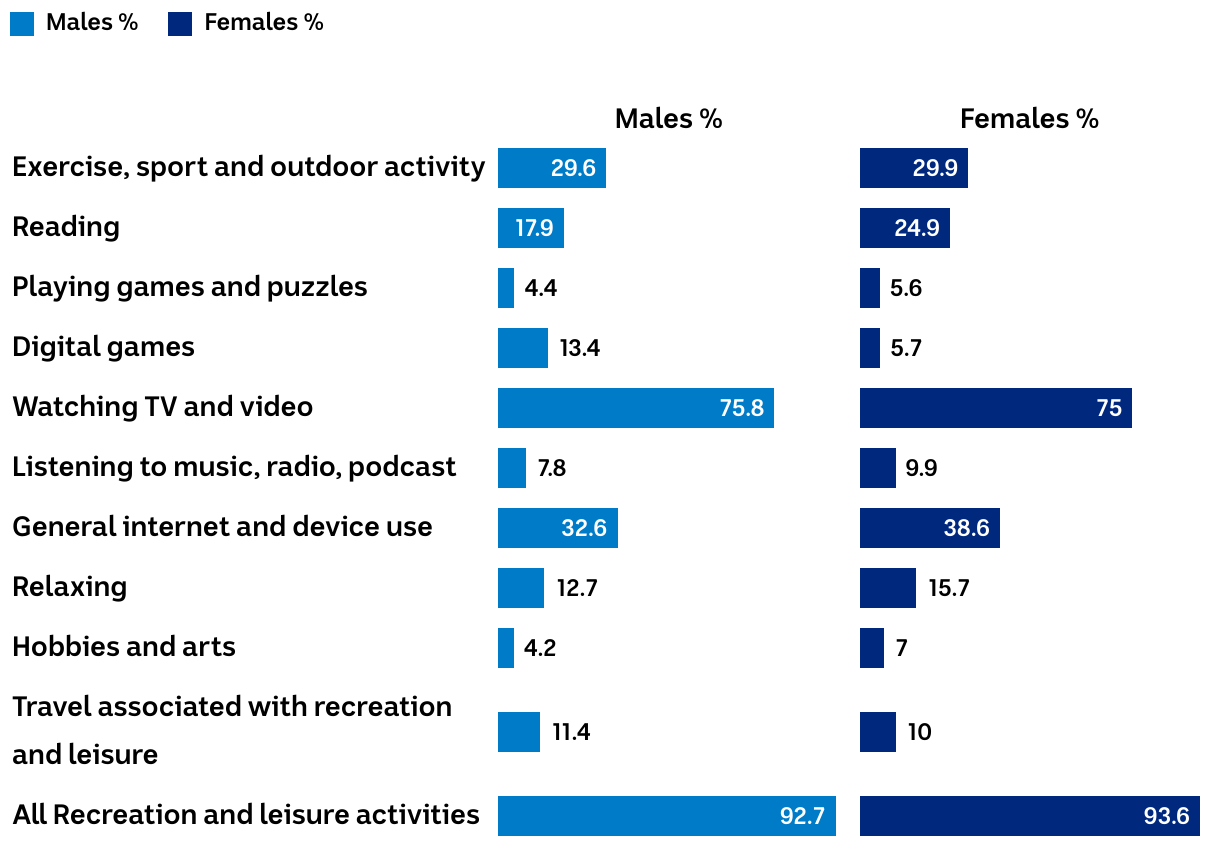
Time spent on various daily recreation and leisure activities
Bar graph showing percentage of men and women taking part in different recreational activities.
(Please use a modern browser to see the interactive version of this visualization)