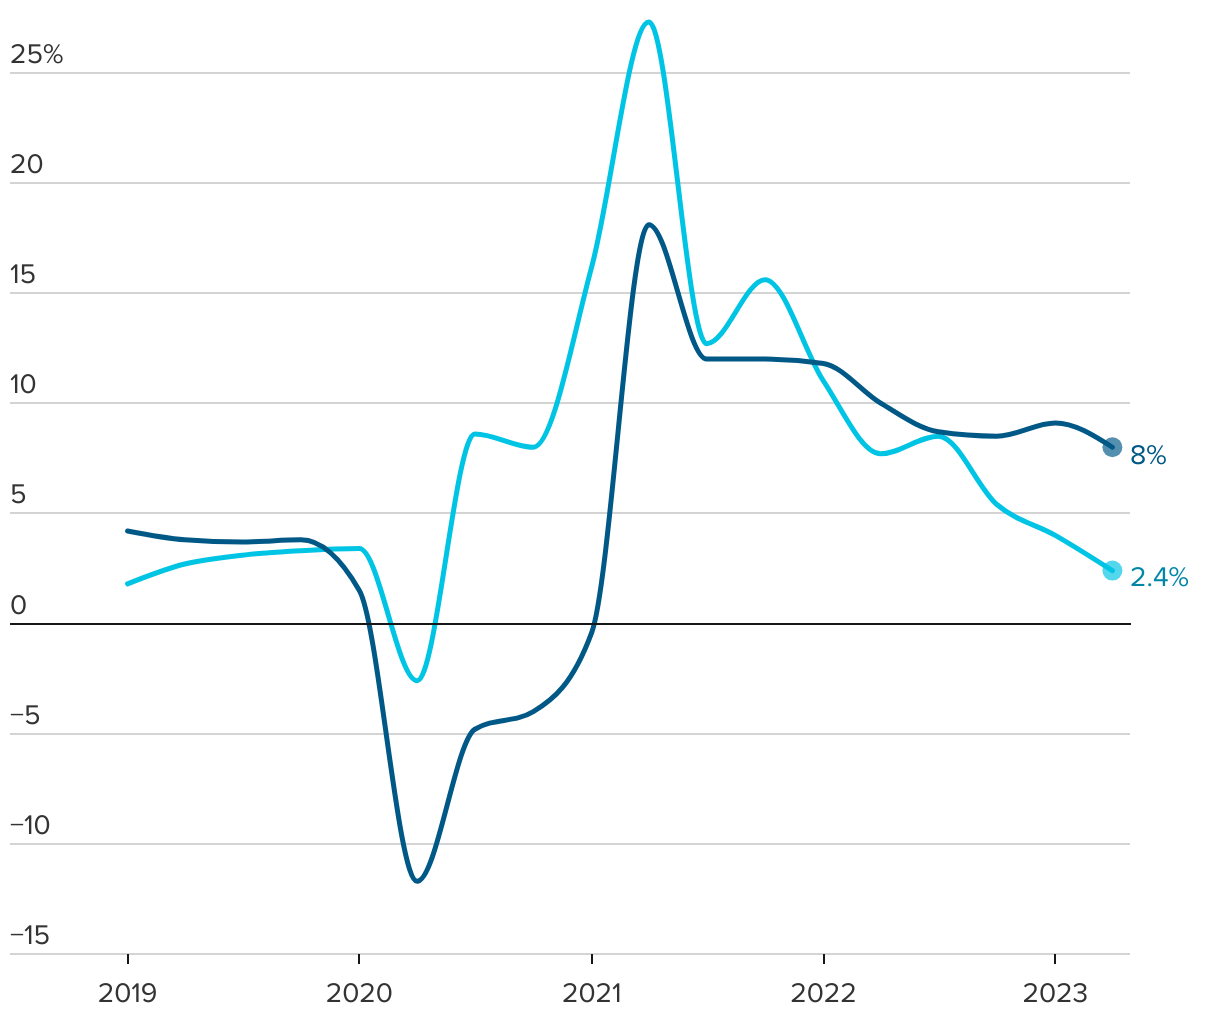
U.S. personal consumer spending on goods and services
Year-over-year percent change as of Q2 2023
The line chart shows the year-over-year percent change of personal consumption expenditures on goods and services from Q1 2019 through Q2 2023.
Year-over-year percent change as of Q2 2023