Days Operating Cash
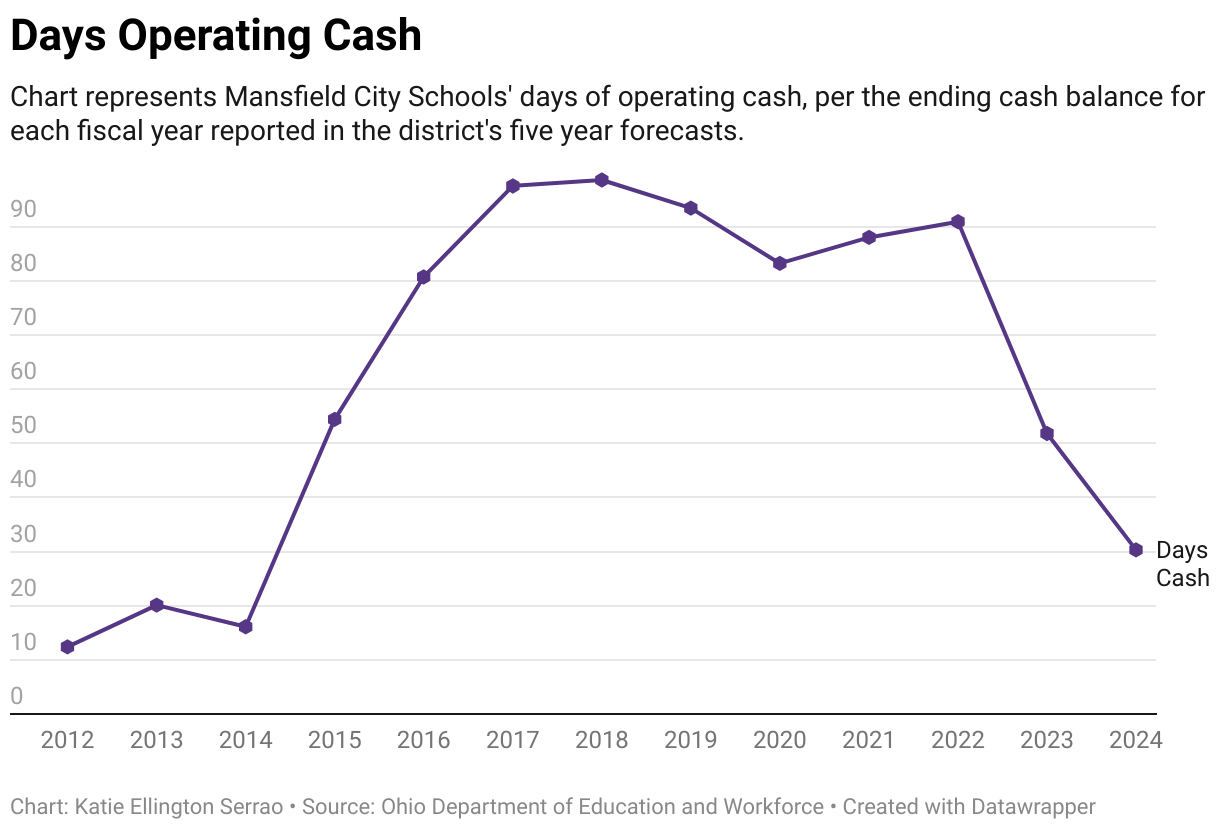
Chart represents Mansfield City Schools' days of operating cash, per the ending cash balance for each fiscal year reported in the district's five year forecasts.
Chart represents Mansfield City Schools' days of operating cash, per the ending cash balance for each fiscal year reported in the district's five year forecasts.
