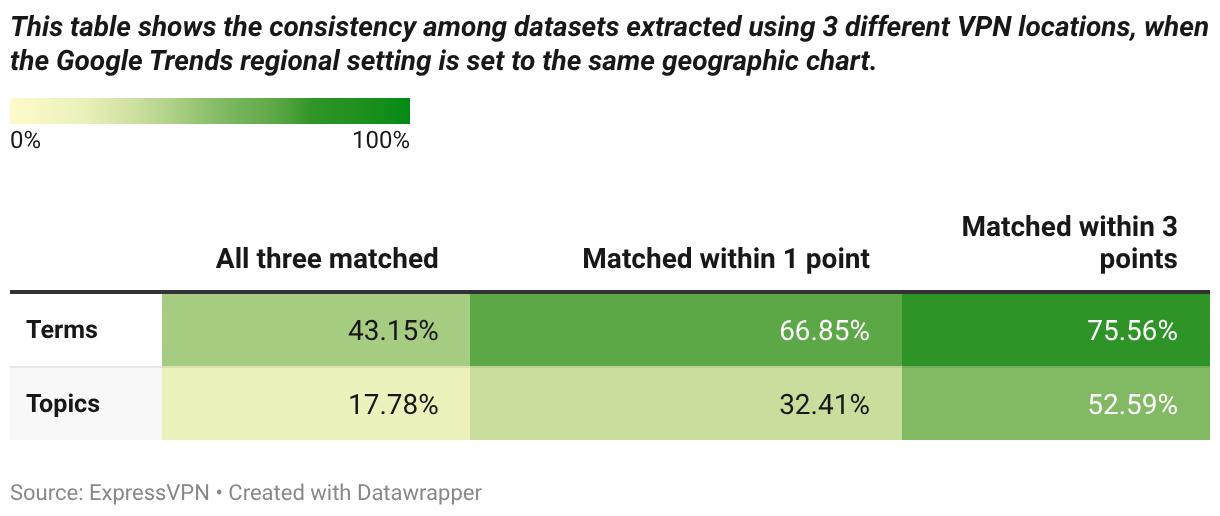
This table shows the consistency among datasets extracted using 3 different VPN locations, when the Google Trends regional setting is set to the same geographic chart.
This table shows the consistency among datasets extracted using 3 different VPN locations, when the Google Trends regional setting is set to the same geographic chart.