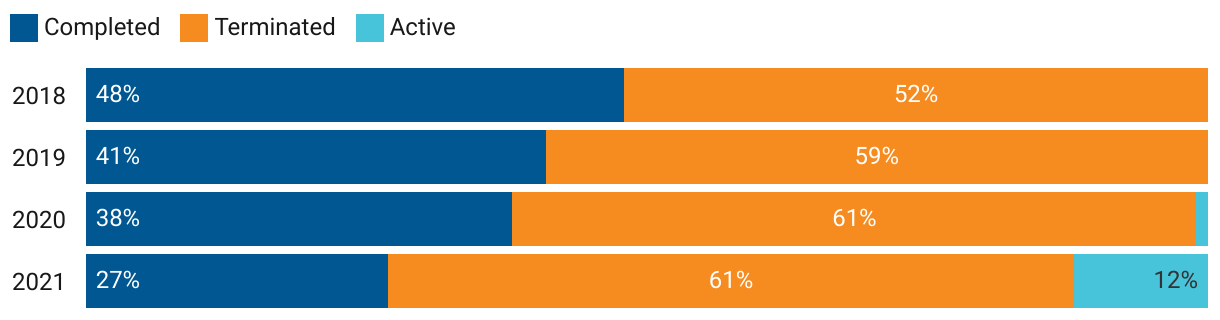
Pretrial electronic monitoring completion in San Francisco, by year of release
This bar graph shows pretrial EM completion rates by year (ranging from 2018-2021). The share that successfully completed EM declines over time, with the lowest share in 2020 & 2021. The figure also includes the share of pretrial EM cycles that are still active, which is highest in 2021.