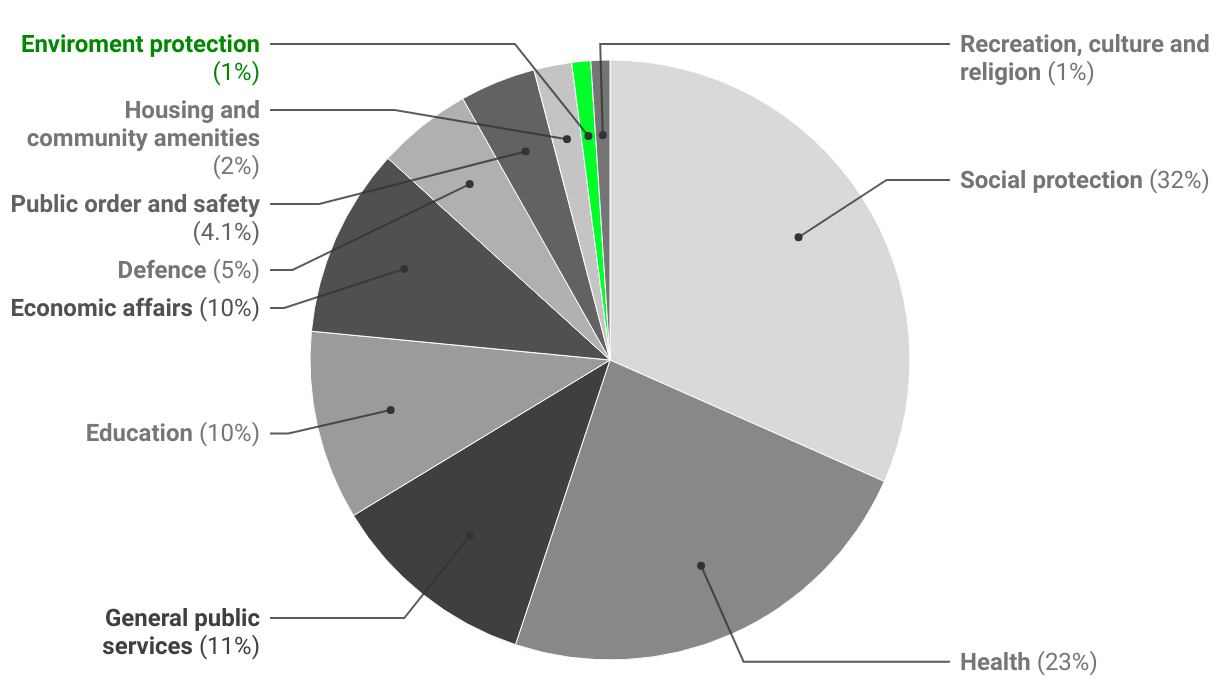
Only 1% of public expenditure is spent on environment protection in the UK
Recent statistics from GOV.UK show that environmental protection was one of the least spent sectors by the government last year.
This is a Pie Chart showing different sectors. Social protection has been spent the most while environmental protection is one of the least spent.