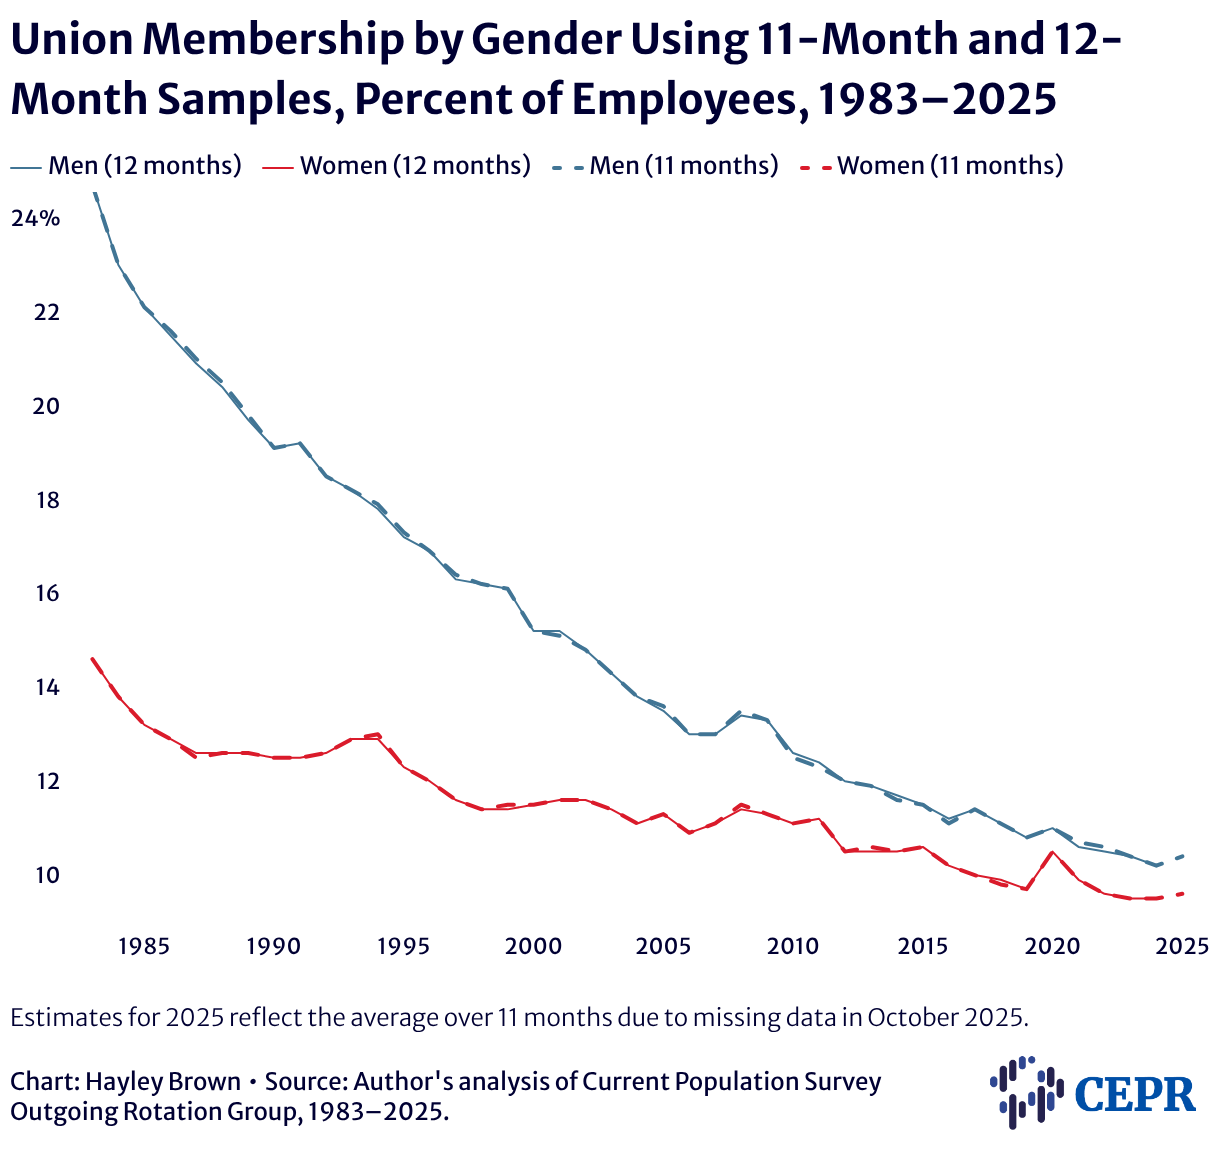
Union Membership by Gender Using 11-Month and 12-Month Samples, Percent of Employees, 1983–2025
Line chart of union membership rates by gender from 1983 to 2025. Solid lines show 12-month estimates and dashed lines show 11-month estimates. Men are shown in blue and women in red. Union membership declines for both groups, with men remaining more unionized throughout the period. 11- and 12-month estimates closely align.

Estimates for 2025 reflect the average over 11 months due to missing data in October 2025.