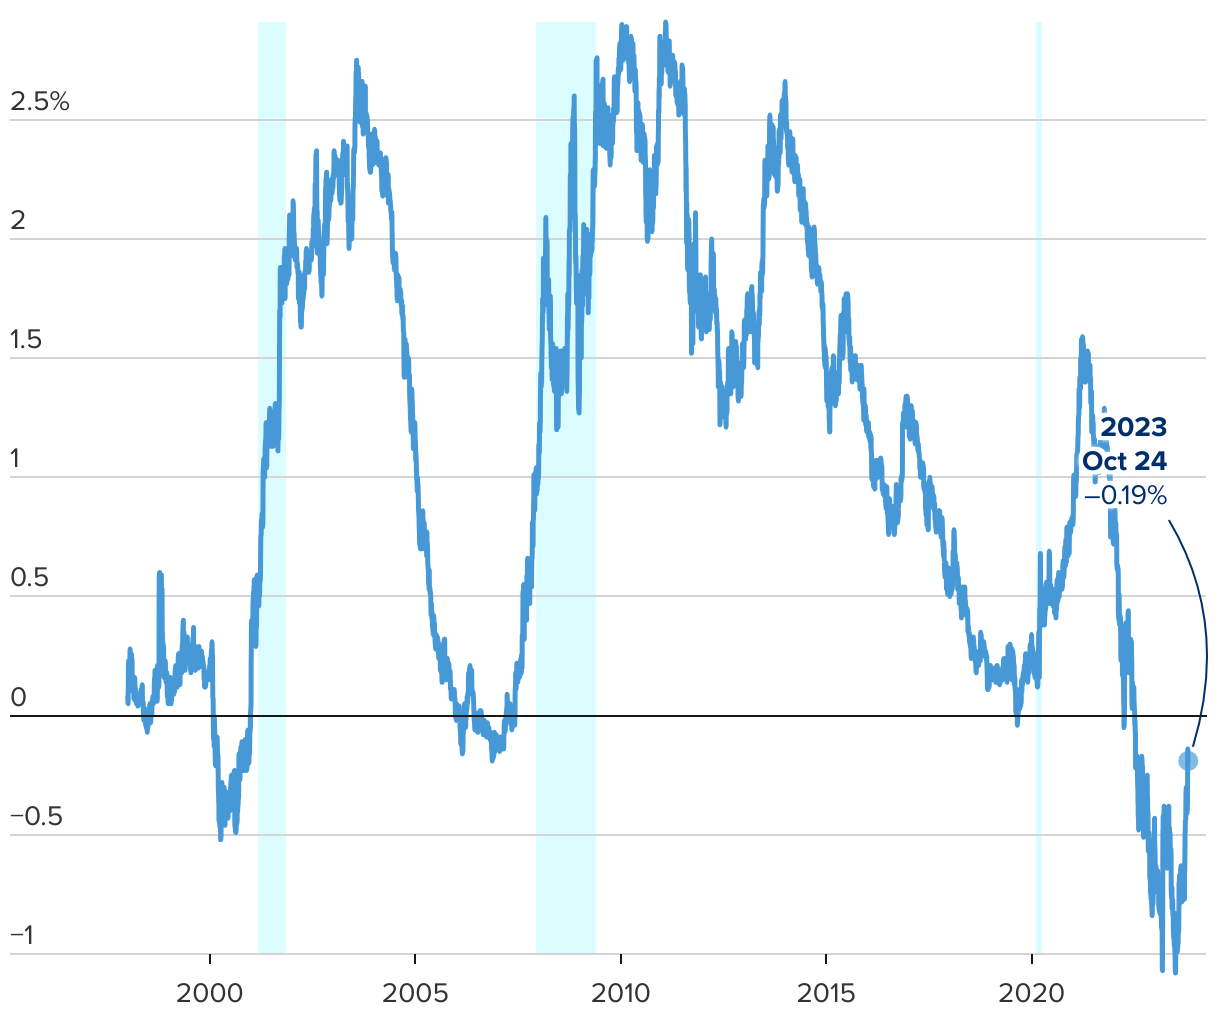
U.S. Treasurys 10-year/2-year spread
10-year Treasury yield minus 2-year Treasury yield
The line chart shows the yield on the 10-year U.S. Treasury minus the yield on the 2-year U.S. Treasury from January 2013 through October 2023.
10-year Treasury yield minus 2-year Treasury yield