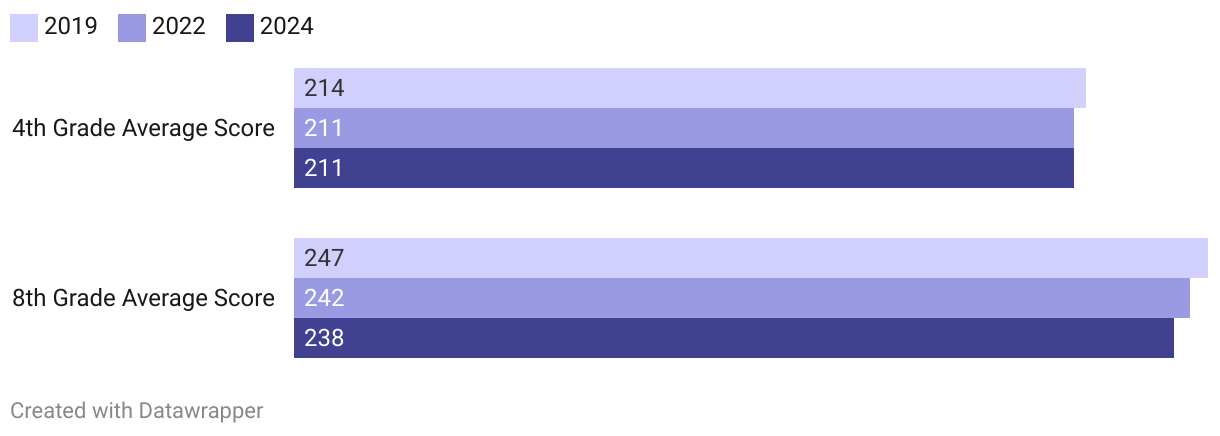
A horizontal bar chart shows average assessment scores for students with disabilities from 2019, 2022, 2024.
(Please use a modern browser to see the interactive version of this visualization)