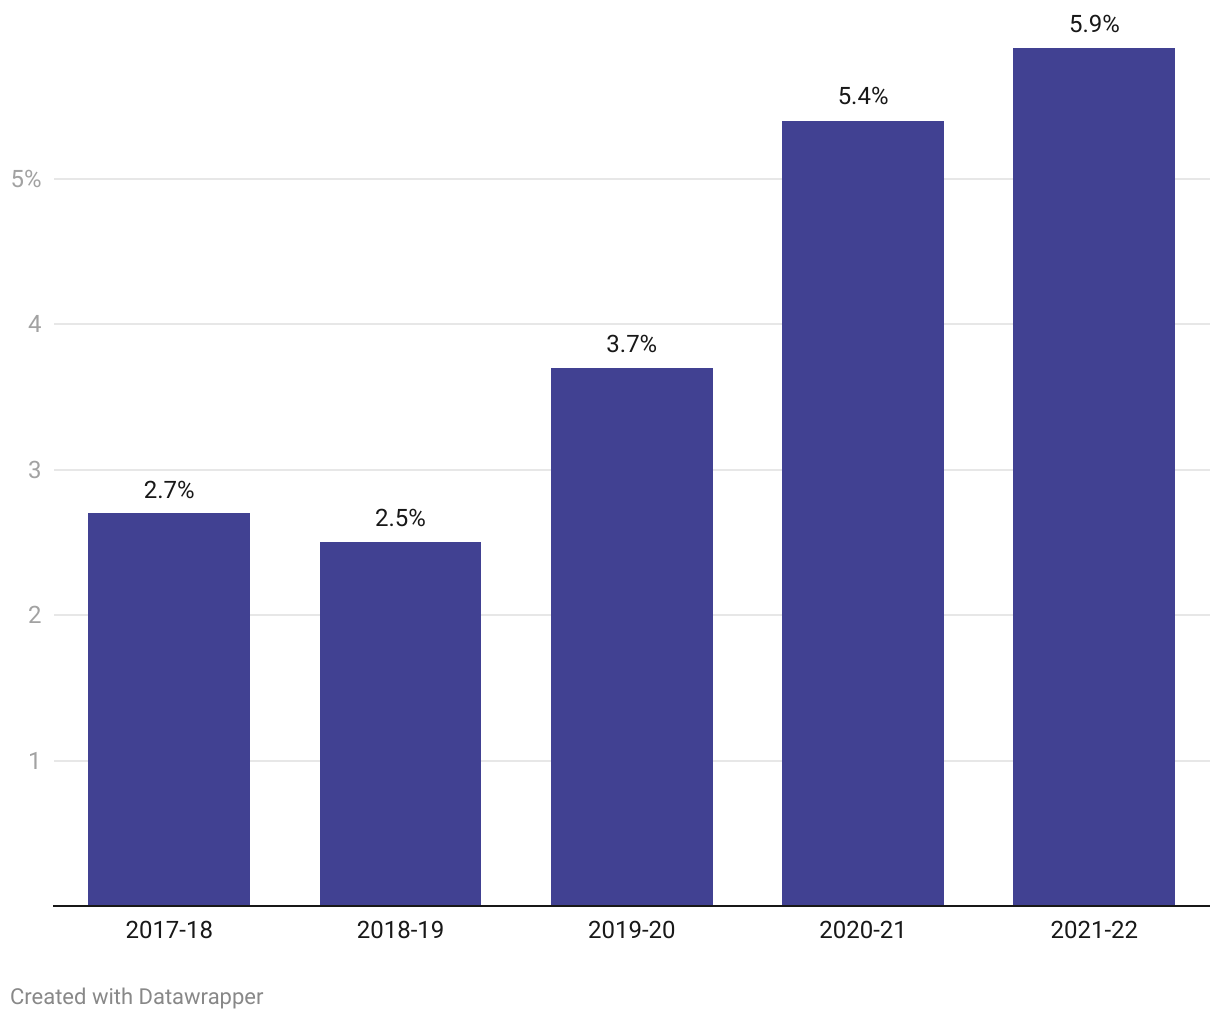
A vertical bar chart shows percentages of school districts with significant disproportionality from the 2017-18 school year through the 2021-22 school year.
(Please use a modern browser to see the interactive version of this visualization)