Response Rates From Recent Elections in King County
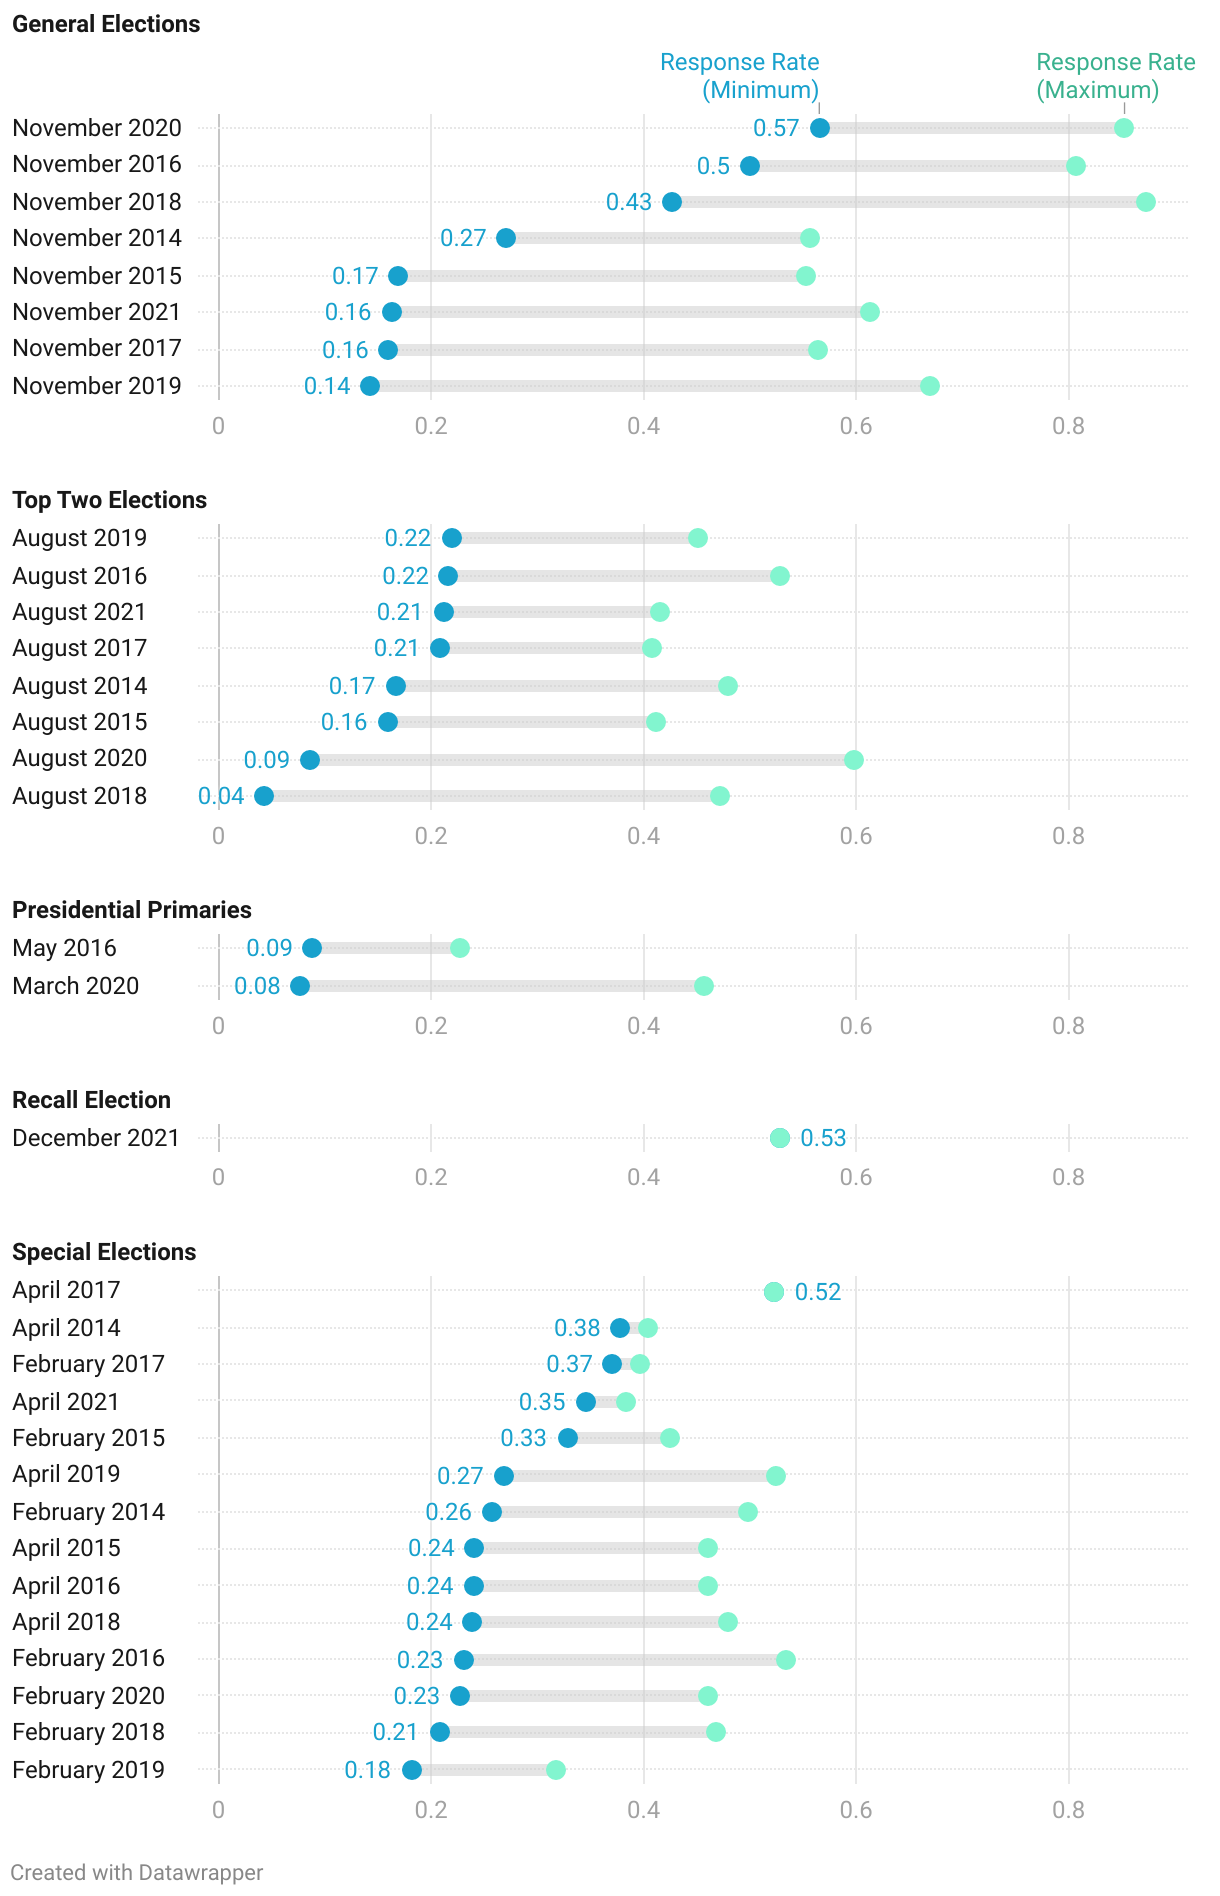
This is a plot of response rate (votes / registered voters) per item for past King County elections. It shows that the majority of items see more response in even years than odd years.
This is a plot of response rate (votes / registered voters) per item for past King County elections. It shows that the majority of items see more response in even years than odd years.