Support for Daylight Saving Time Dims
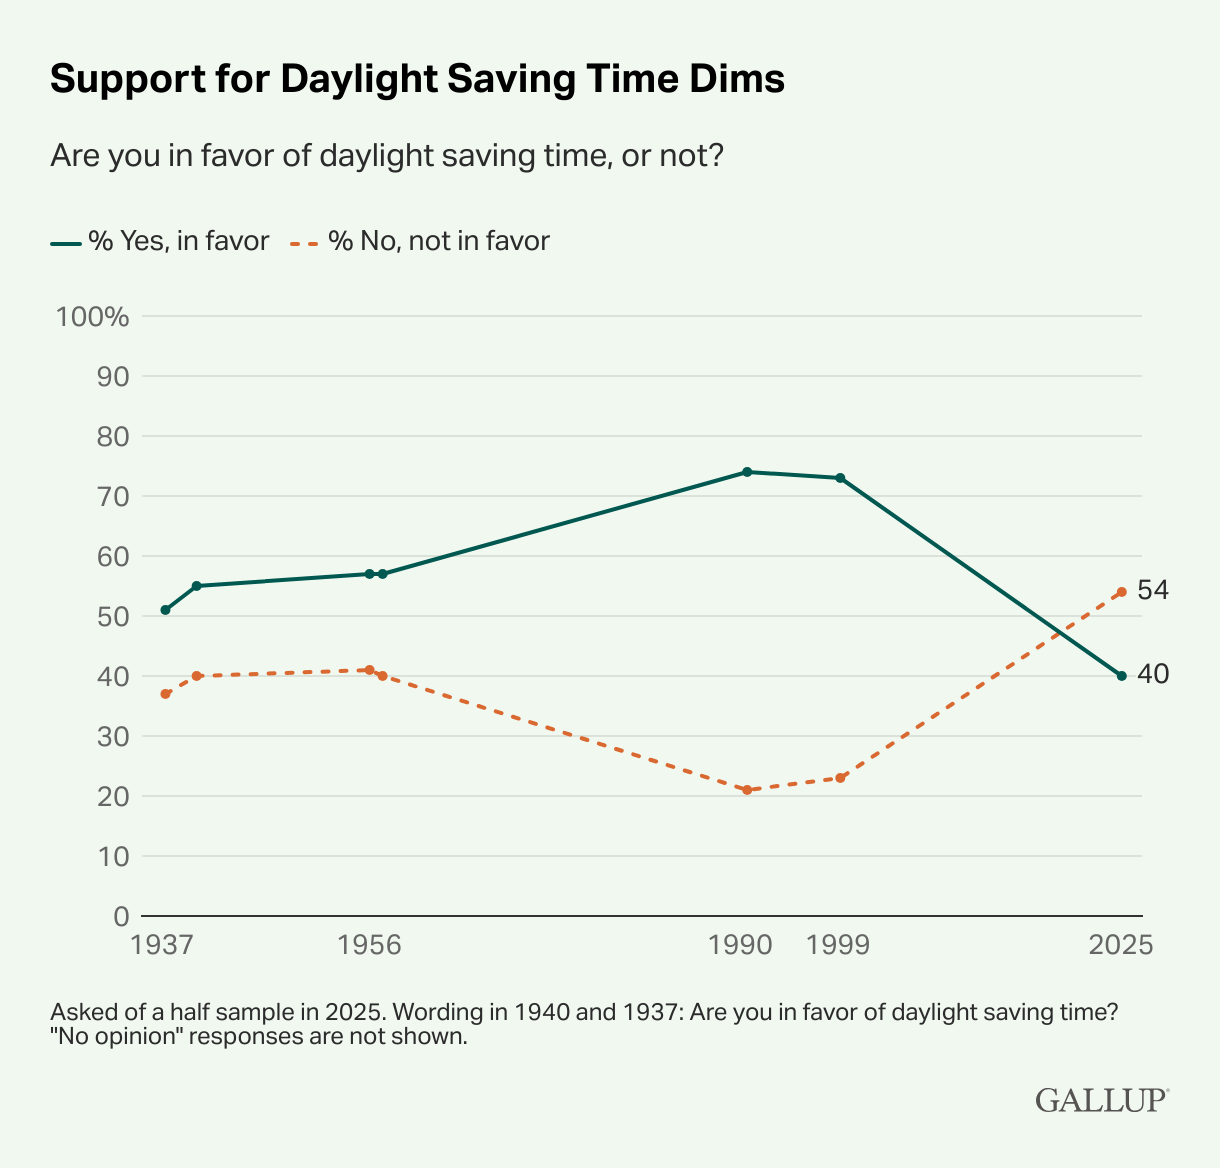
Are you in favor of daylight saving time, or not?
The line chart titled "Support for Daylight Saving Time" tracks public opinion on daylight saving time from 1937 to 2025, showing the percentage of Americans in favor and opposed. The solid teal line represents those in favor, while the dotted orange line represents those opposed. Support peaked around the 1990s at over 70% but declined sharply in the 2025 poll, the next time Gallup asked about it, reaching 40%. Opposition followed an inverse trend, declining to around 20% in the 1990s before moving to the majority level, 54%, in 2025. The latest data suggest a significant shift in public opinion, with more Americans now opposing daylight saving time than supporting it.
