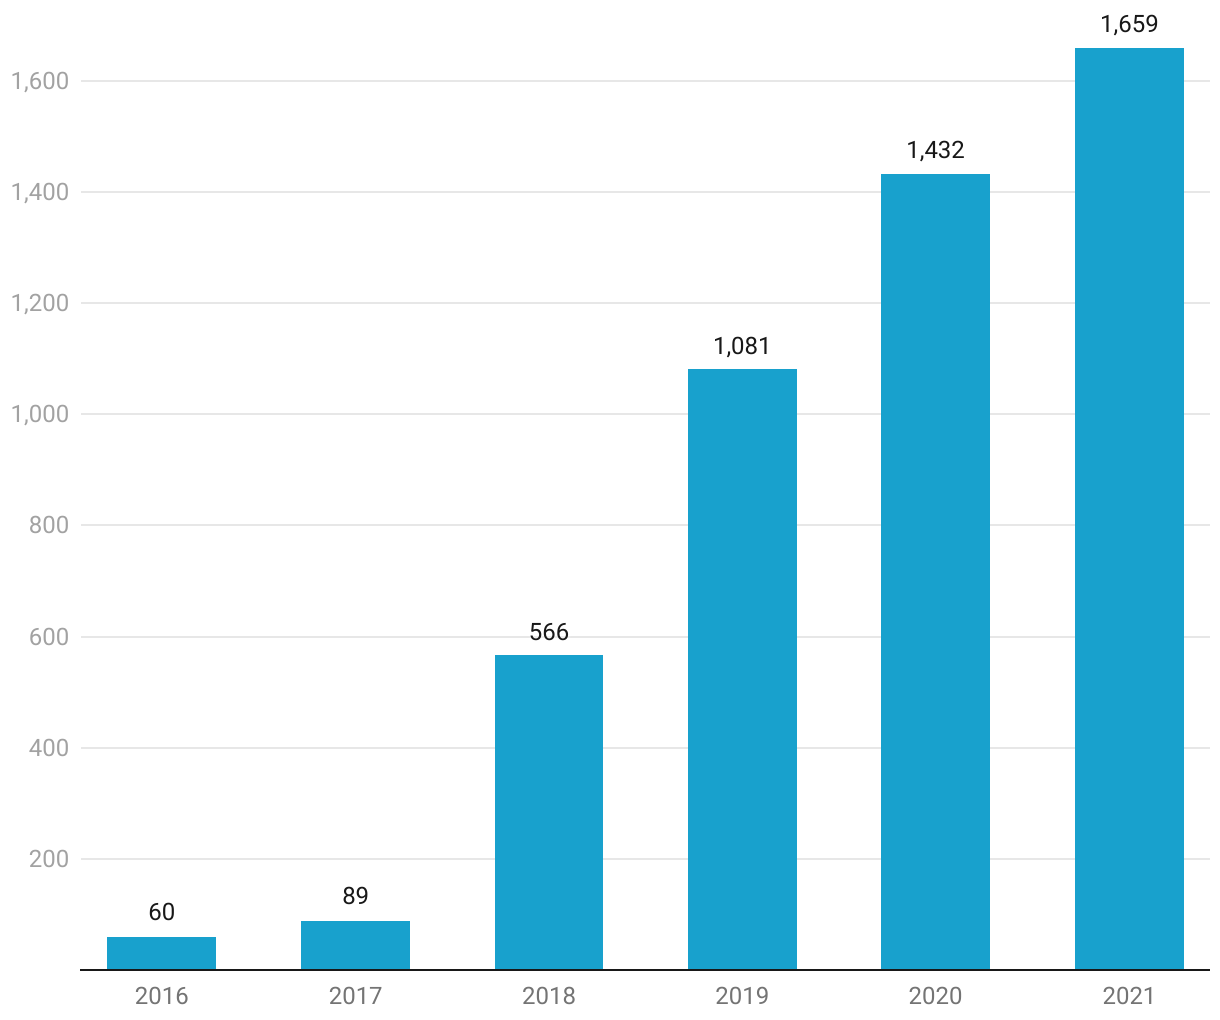
Number of pretrial electronic monitoring cycles in San Francisco, 2016–21
In this bar graph, there are six bars and each bar represents the number of pretrial electronic monitoring cycles per year. The years range from 2016-2021 and the lowest number of cycles are in the first two years (60 and 89 respectively). The numbers jump in subsequent years, with the greatest number of pretrial EM cycles in 2021 (1,659).