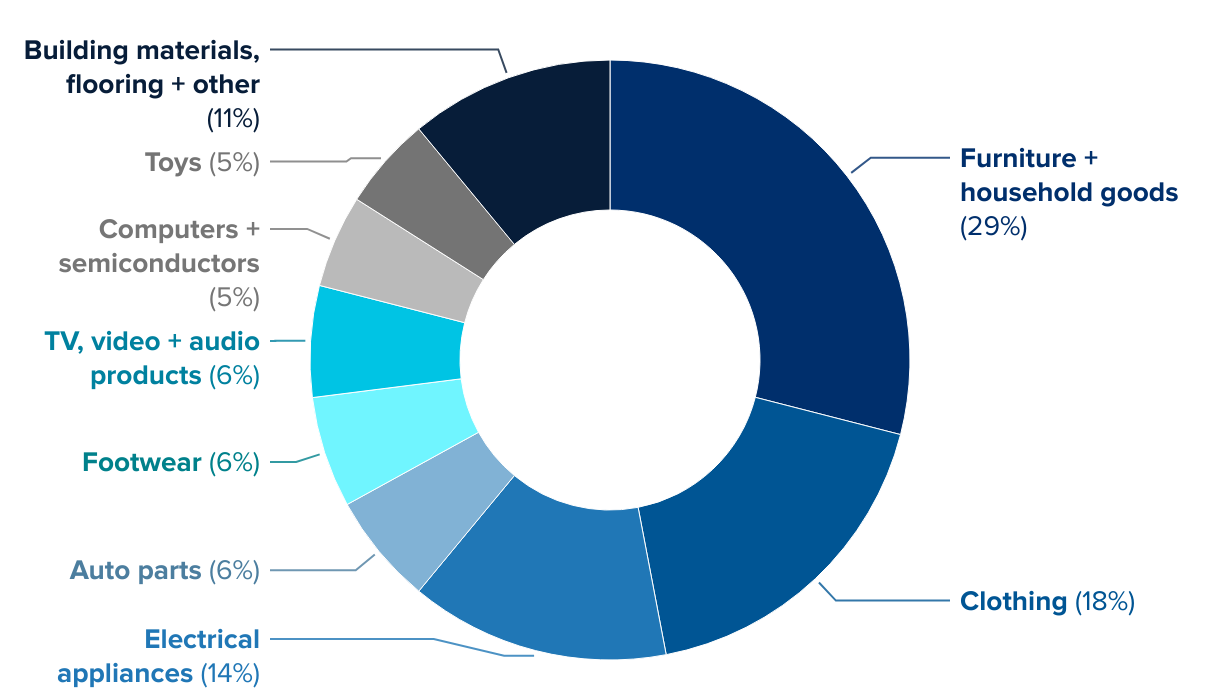
Container breakdown by commodity
The doughnut chart shows the breakdown of what's in shipping containers, by category and by percentage.
(Please use a modern browser to see the interactive version of this visualization)