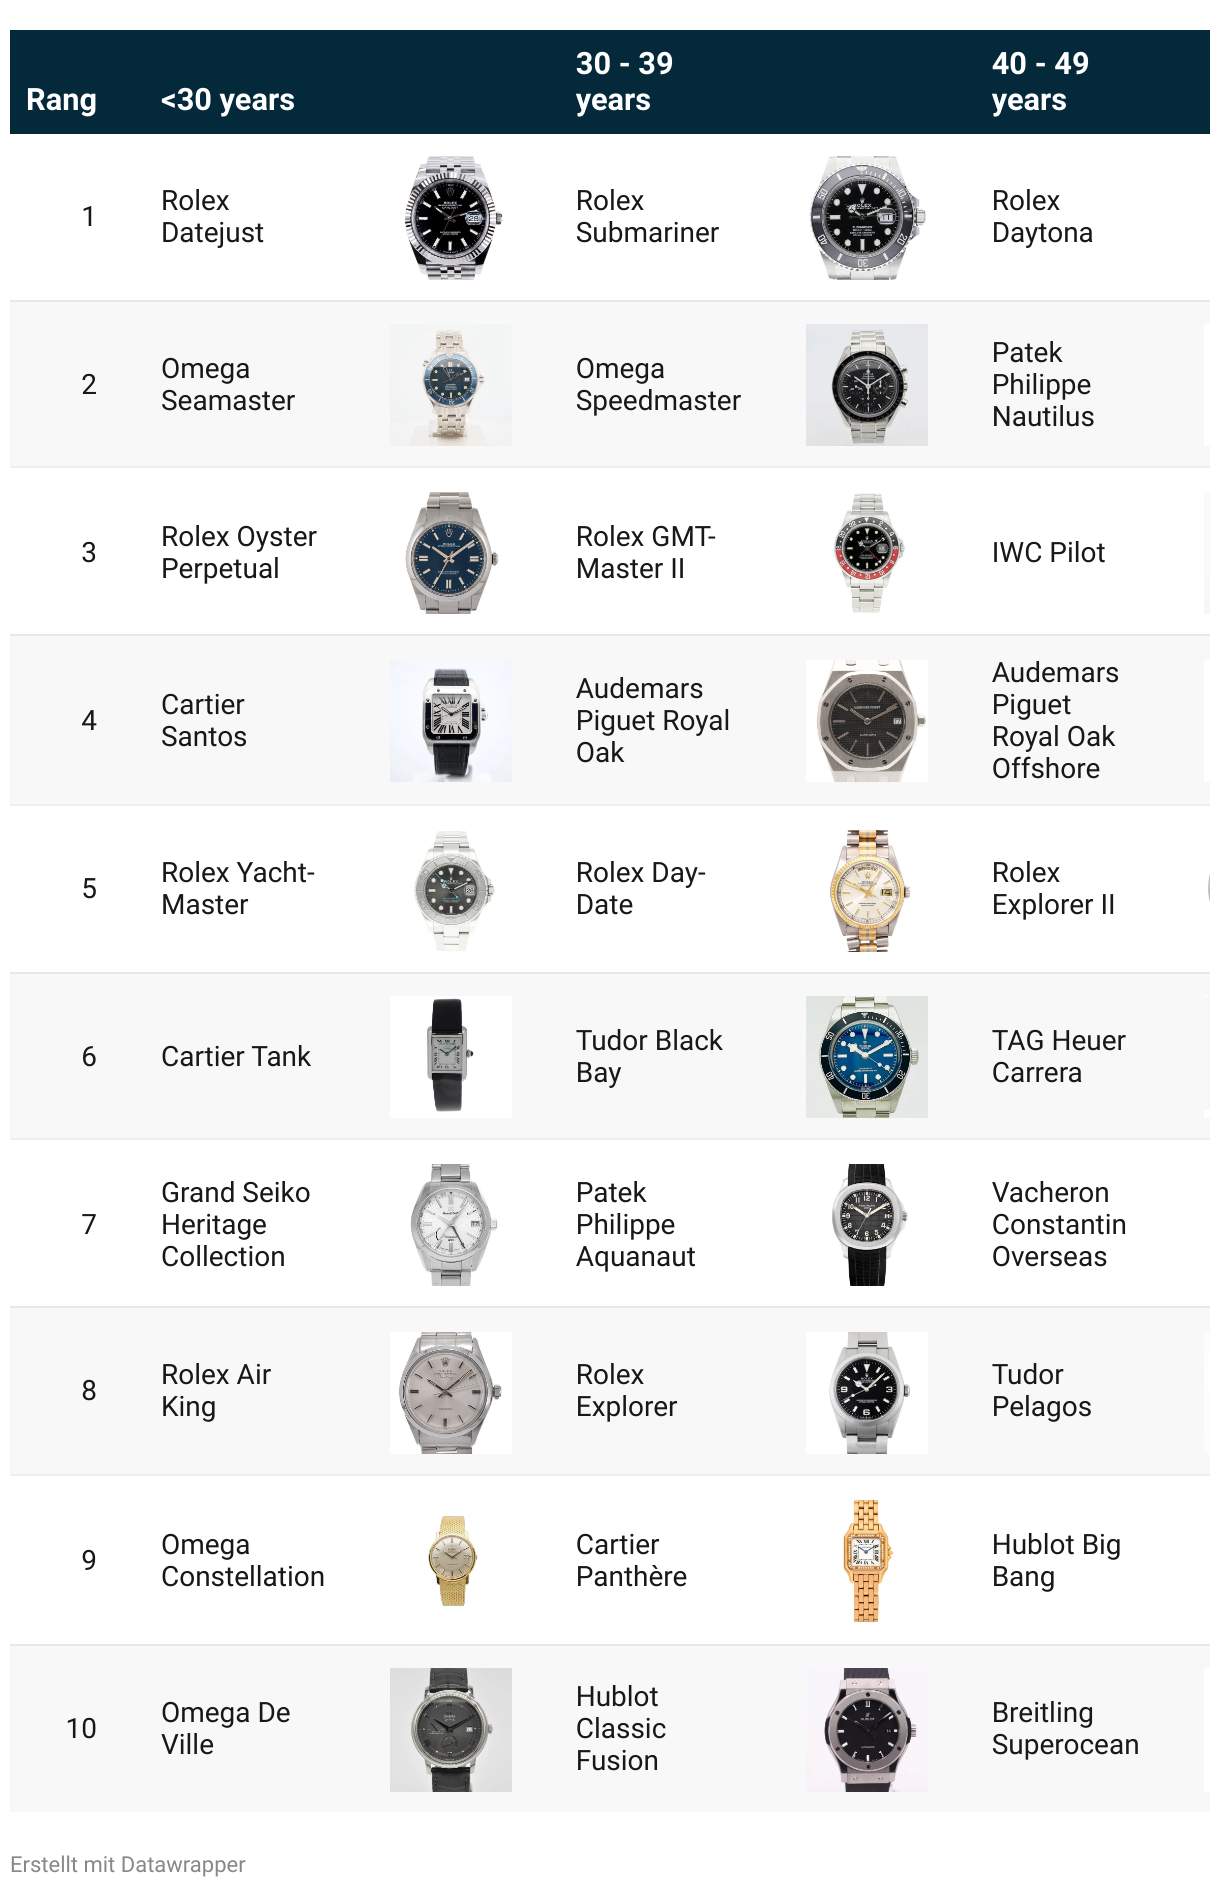
The graph shows which models are in above-average demand across different age groups:
(Please use a modern browser to see the interactive version of this visualization)