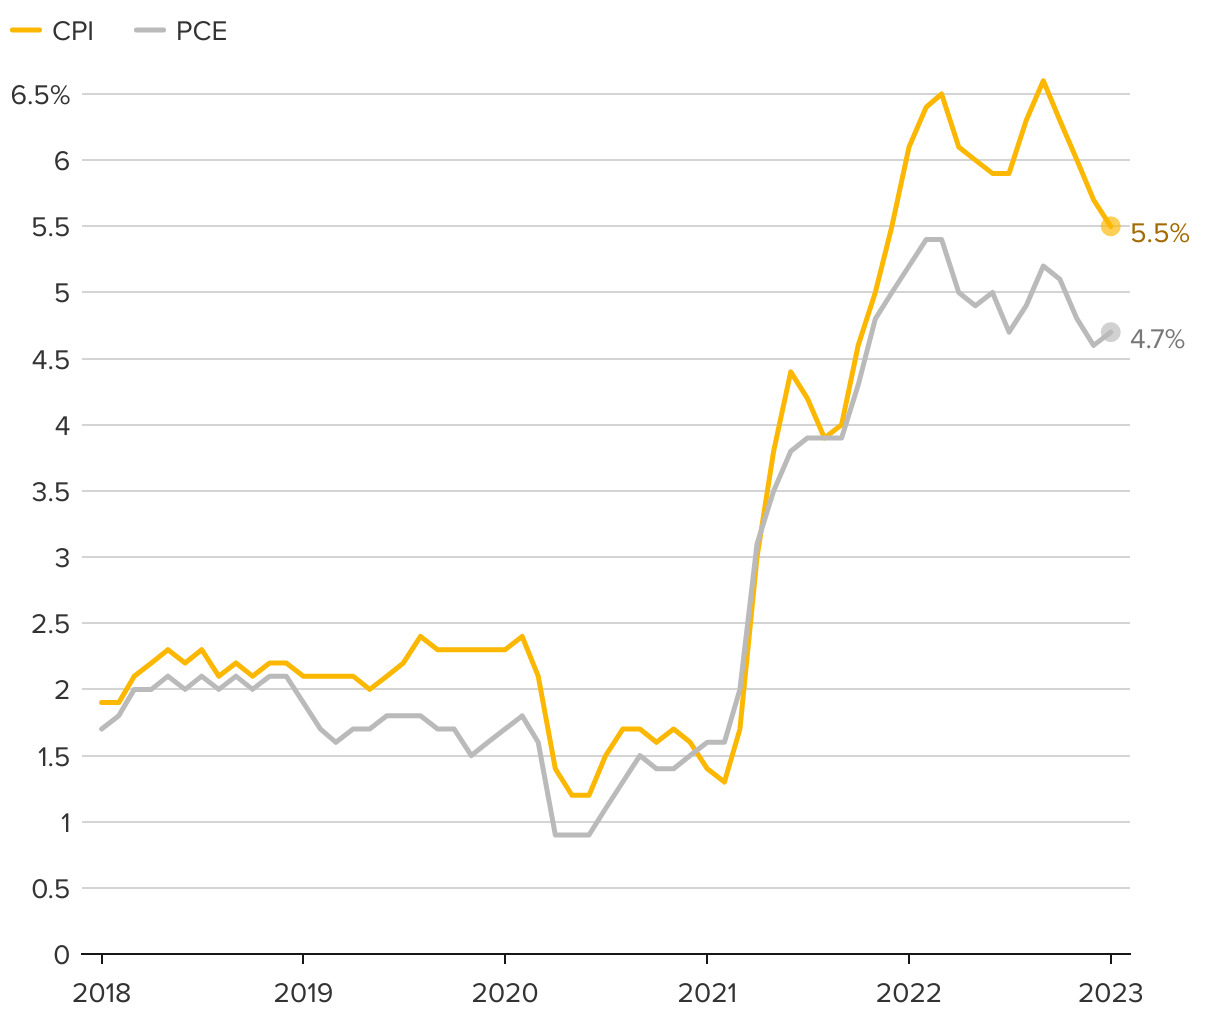
U.S. consumer price index and personal consumption expenditures, excluding food and energy
Percent change from a year ago, January 2018 through January 2023
The line chart shows the year-over-year percent change in the consumer price index and personal consumption expenditures, excluding food and energy, by month, from January 2018 through January 2023.