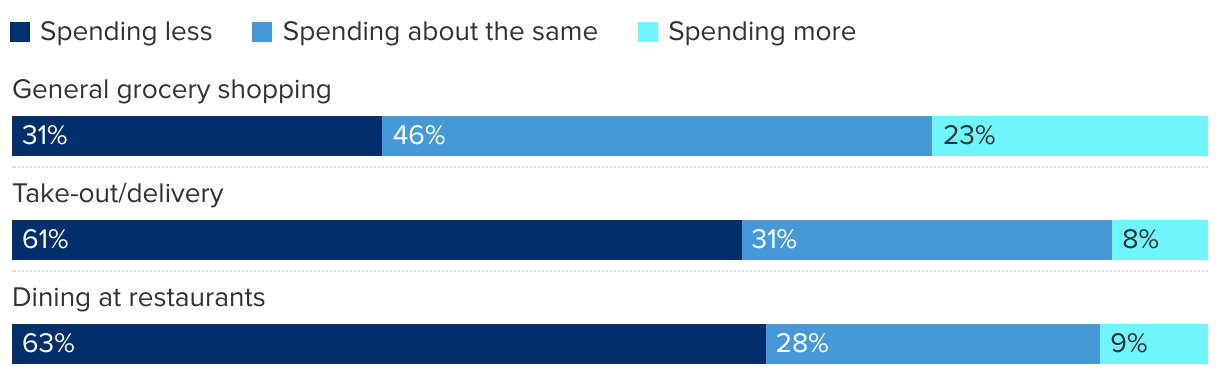
Changes in monthly spending on food after starting a GLP-1
The horizontal bar chart shows the share of survey respondents who say they are spending more, less or about the same on groceries and eating out after beginning treatment on a GLP-1.
(Please use a modern browser to see the interactive version of this visualization)