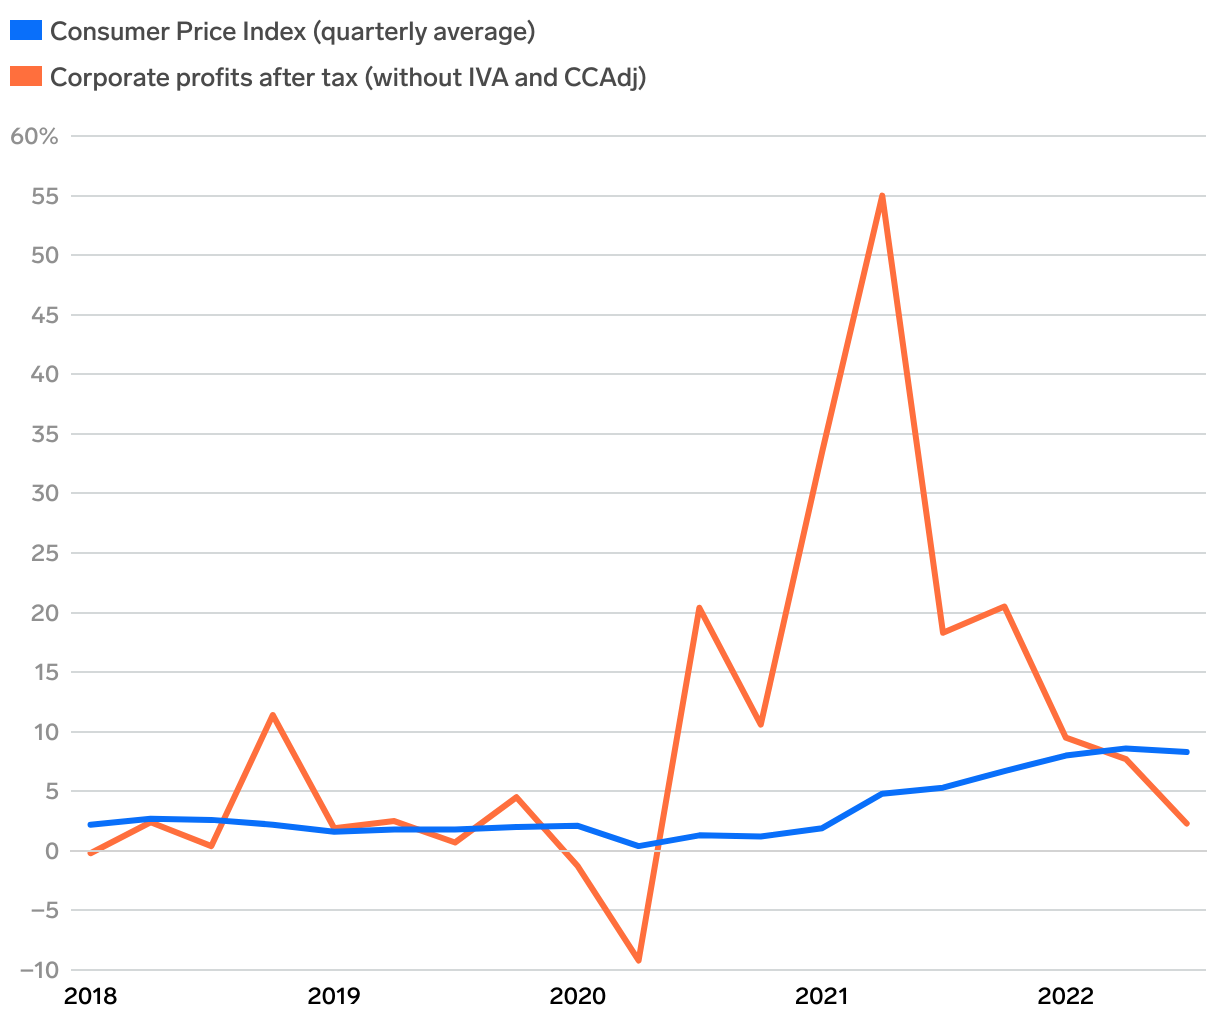
Changes from a year ago in the Consumer Price Index and corporate profits
Line chart with two lines showing the change from a year ago in the Consumer Price Index and corporate profits each quarter. The chart starts at the first quarter of 2018.
(Please use a modern browser to see the interactive version of this visualization)