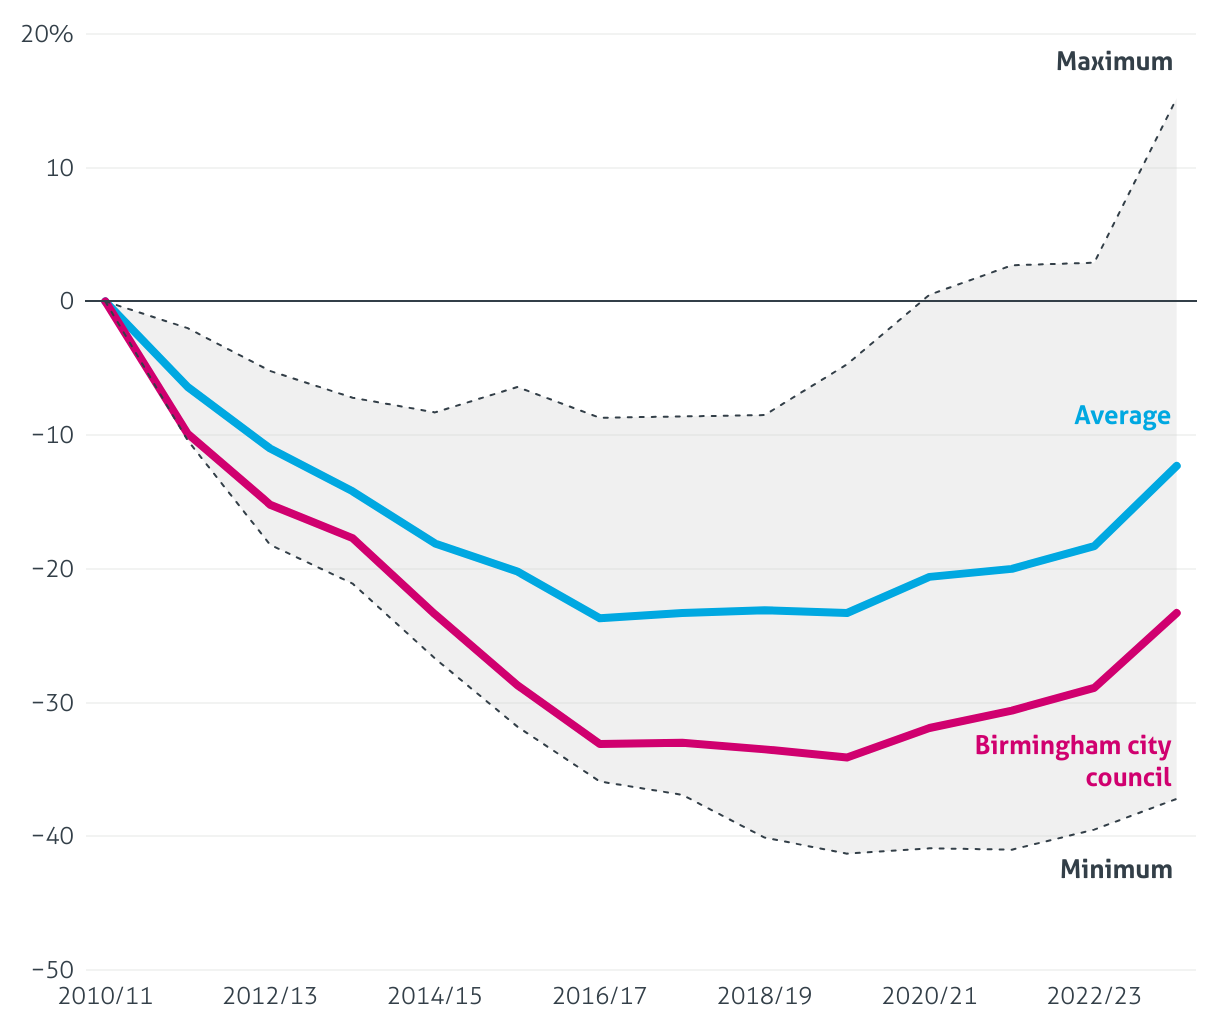
Change in upper and single tier local authority core spending power since 2010/11 (real terms)
(Please use a modern browser to see the interactive version of this visualization)