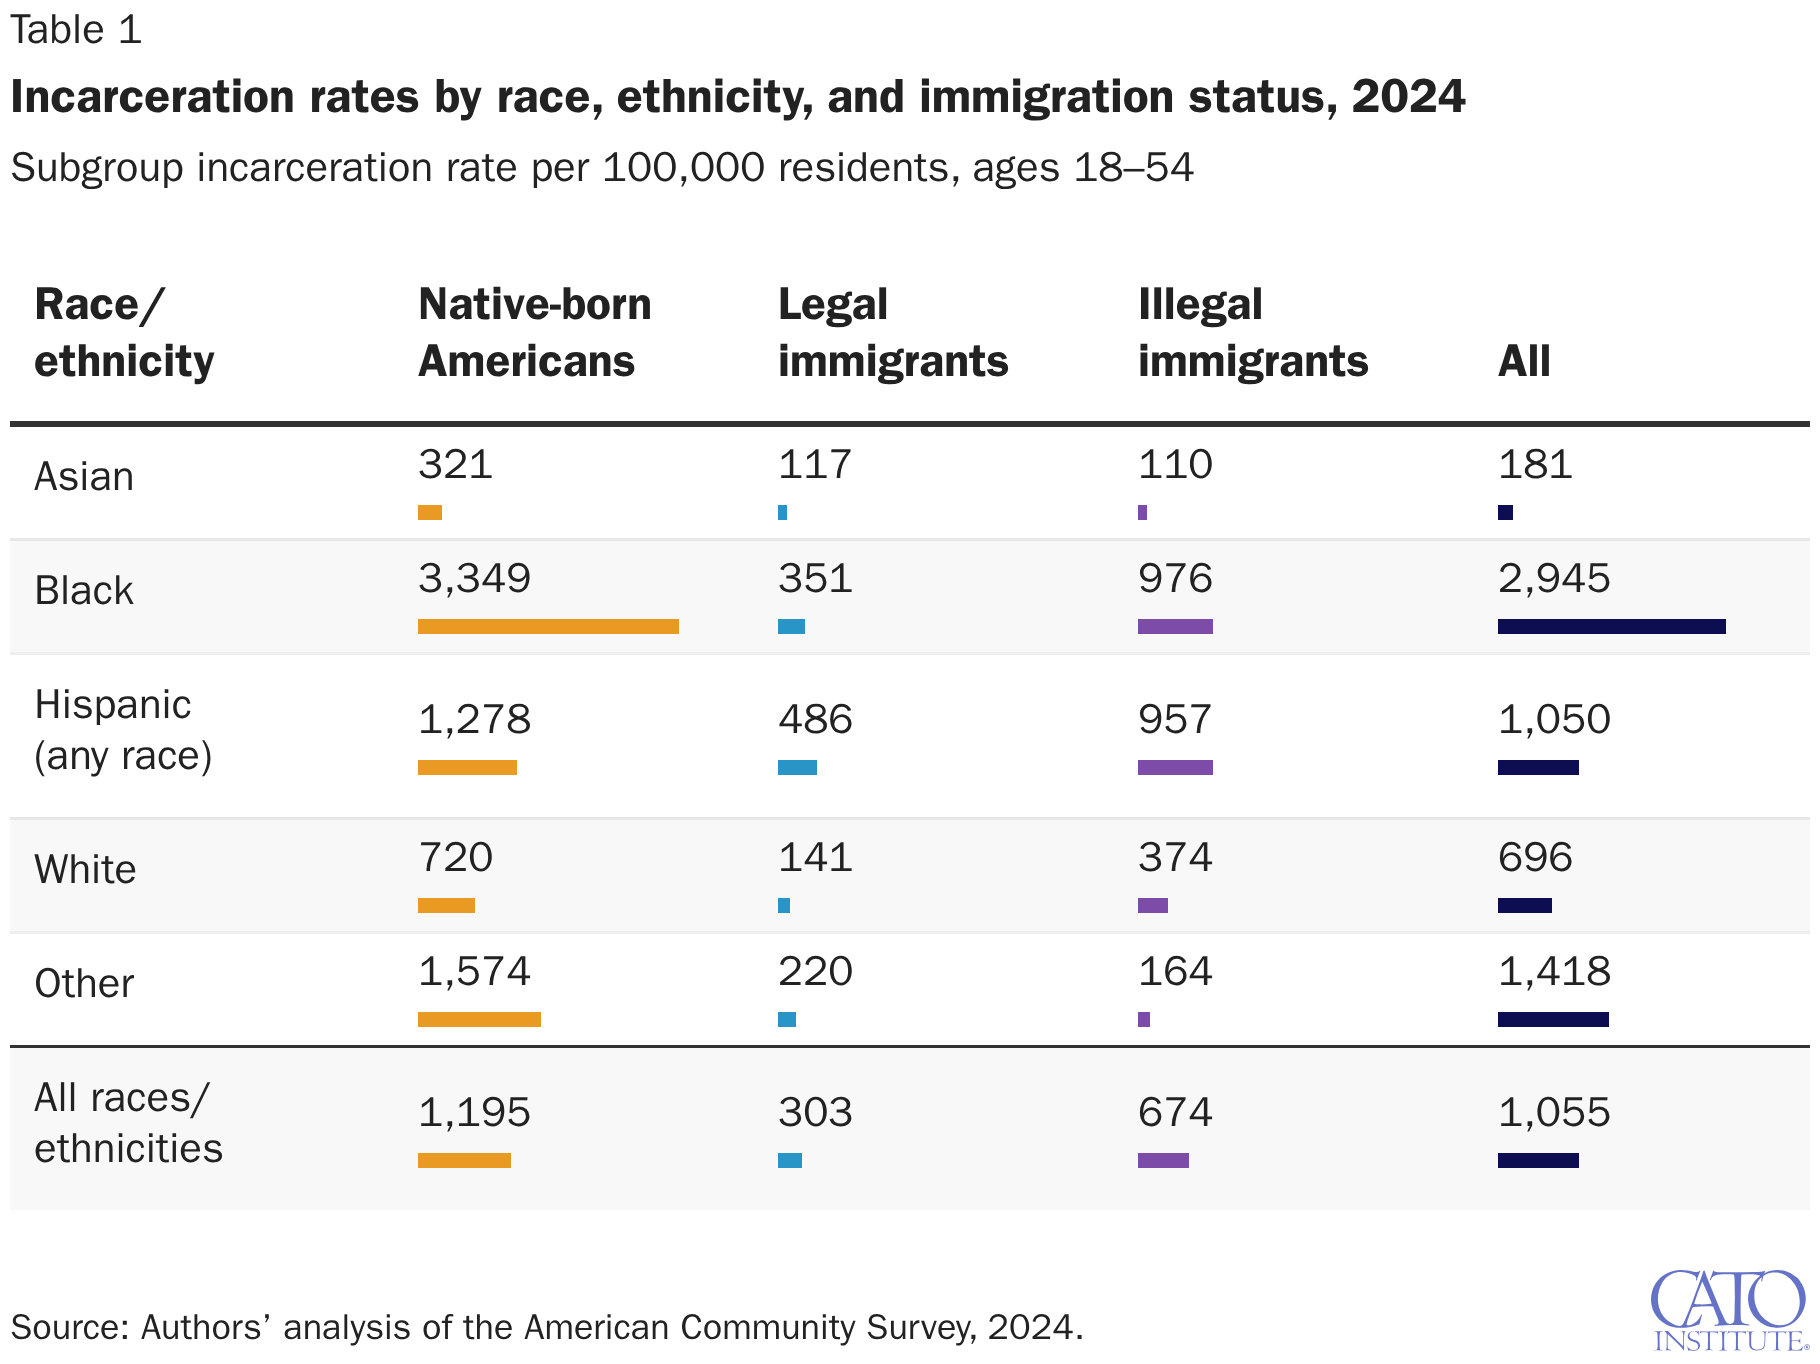
Subgroup incarceration rate per 100,000 residents, ages 18–54
(Please use a modern browser to see the interactive version of this visualization)
